
Decarbonization Pathways and Policy Recommendations for the United States Steel Sector
Executive Summary
- Steel production is a significant greenhouse gas emitter, responsible for 2% of U.S. greenhouse gas (GHG) emissions, and 8% of global GHG emissions. To meet climate-change targets, the global steel industry must undergo significant decarbonization.
- The U.S. is already a leader in low-carbon steel production, with an average carbon intensity below that of other major producing countries. The ‘big four’ steel producers1 in the U.S. have recognized the need for further decarbonization, and all have pledged net-zero or near-net-zero steel production by 2050.
- Approximately 70% of the steel produced in the U.S. is made by remelting metallics, primarily scrap, in electric arc furnaces (EAFs). This is a relatively low-carbon route of steel production, which gives the U.S. a steelmaking carbon emissions intensity that is lower than other regions of the world. As electricity is the primary energy source for this process, further decarbonization via the use of clean electricity can be done with no additional capital spending or process changes. CRU estimates that converting current power consumption by all steelmaking (both EAF and integrated steel mills) to clean electricity would reduce carbon emissions by 35% from present levels.
- At the same time, the impurities found in scrap restrict the number of products that can be made using scrap; thus, 30% of steel continues to be produced by the blast-furnace-based integrated route. This route produces the highest-quality products that are sensitive to contaminants found in scrap.
- EAF production continues to take market share from integrated production, however, the volume and quality of scrap available is insufficient to fully replace integrated production for high-quality products. CRU estimates that roughly 30 Mt/y of high-quality ore-based metallics (OBMs) such as pig iron and direct reduced iron (DRI) will be needed to produce the forecasted volume of high-quality, low residual steel products. Even now, the U.S. imports roughly 5 Mt of OBM yearly for EAF production, and that will increase unless OBM production in the U.S. increases as well.
- Overreliance on imported OBM will increase the vulnerability of domestic steelmaking supply chains as well as export scope 3 carbon emissions, thus doing nothing to help with global decarbonization. A variety of policy measures could be implemented to counter this issue, such as tariffs or carbon taxes on imported OBM or requirements for federally funded infrastructure projects to use OBM produced in the U.S.
- Currently, high-quality OBMs in the U.S. are produced primarily in six operating integrated mills with coal-fired blast furnaces, along with three direct reduced iron (DRI) plants firing natural gas. To decarbonize the OBM process, production plants will need to be equipped with carbon capture and storage (CCS) systems or converted to DRI plants using green or low-carbon hydrogen. At current hydrogen prices, CCS is a more cost-effective technology and can provide significant carbon abatement (60% – 90%) but will struggle to provide full decarbonization.
- With decarbonization adding significant cost to the production process for a relatively low-cost, low-margin commodity material, some form of policy support will be necessary to provide additional incentives for decarbonization. Demand side incentives for green steel, such as requirements for green steel in federally funded infrastructure projects is one example. On the supply side, tighter environmental regulations such as those for hazardous air pollutants on integrated iron and steel production, as well as subsidies for lower-carbon production facilities are already underway. Carbon taxes, combined with a carbon border adjustment mechanism (CBAM) as used in the EU would be another option.
Decarbonization of the steelmaking process is critical to meeting global emissions targets
Steel is fundamental to economic development. It is an essential material in the construction of the consumer goods which maintain gross economic output, infrastructure like roads and bridges, and utilities that support existing and developing markets. Because steel production is essential to the economic success of the U.S. and many other countries, it would be unwise to lower emissions through a reduction in output or material substitution. Thus arises a need for realistic, economically sound abatement pathways which do not inhibit status quo manufacturing activity. The challenge lies in the fact that steel emissions are inherently difficult to abate due to the chemistry and physical constraints of the process.
The steel industry is a leading contributor to greenhouse gas (GHG) emissions, with iron and steel production accounting for 7-9% of global anthropogenic GHG emissions,2 and the U.S. steel industry accounting for 1-2% of total anthropogenic U.S. GHG emissions in 2023.3 Because of this, the industry has embarked on a challenging journey to reduce emissions through advancing carbon reduction technology and process efficiency. The pathways required to meet the “green”4 steel standard are complex and require further technological development. Thus, transition to a green steel market will require immense efforts from the entire steel value chain and support from policy makers.
The primary pathways for decarbonizing iron production involve either replacing natural gas with low-carbon hydrogen or capturing and storing CO2 emissions using carbon capture and storage (CCS) technologies. Low-carbon or ‘clean’ hydrogen can be produced through two main methods: electrolysis of water using low-carbon electricity, or the application of CCS to hydrogen production from natural gas. Each of these options present economic, operational, and emissions-related considerations that steelmakers must carefully evaluate. This report provides a review of the steelmaking industry in the United States, with a focus on current and future steelmaking pathways for decarbonization.
Regional dynamics and production methods in the United States steel industry
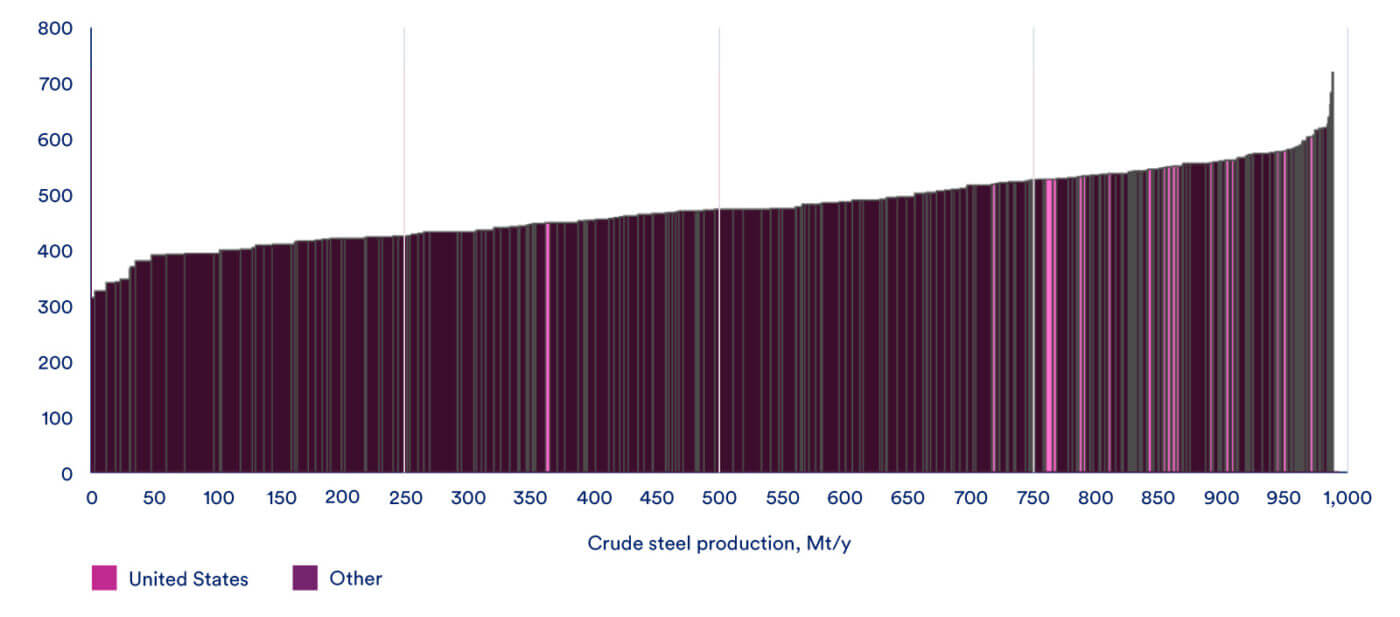
The United States steel industry is a well-developed, mature industrial market. In 2023, total steel demand in the U.S. was 88 million tonnes (Mt), equivalent to ~5% of the global market. The $100 billion industry sits below all other major steel producing countries on the global emissions curve found in Figure 13, but well above the global average site cost5 shown in Figure 1. This is, in large part, due to the value chain’s structure and the production routes it is built upon. Most of the crude steel (70%) is produced by remelting scrap in electric arc furnaces (EAFs). These facilities can be found all around the U.S., but a growing majority are in the South where scrap supply is strong, and manufacturing and construction demand is growing. The remaining 30% comes from integrated mills clustered around the Midwest and Great Lakes region. These are primary steelmaking facilities, which use the coal-fired blast furnace (BF) process to produce iron directly from iron ore, combined with basic oxygen furnaces (BOF) for steelmaking.
Figure 1: Global site costs, USD / t crude steel
The United States does not produce sufficient steel to meet domestic demand and imports a net 8% of steel for domestic consumption.6 U.S. trade reliance occurs for a variety of reasons, including 1) the often-lower cost of imported steel, 2) tightly integrated United States-Mexico-Canada (USMCA) supply chains (the largest sources of imported steel are Canada and Mexico; these are also the largest importers of steel from the U.S.), and 3) the availability of semifinished steel for domestic processing.7 Imports also benefit from cost-effective transportation, as some regions may see lower transportation costs via ship-based imports rather than by trucking or railing from a distant U.S. mill. Although tariffs (including the 25% Section 232 tariffs8) have alleviated pressure to a certain extent on domestic producers, imports continue to maintain a significant share of the domestic steel market. Producing every type of steel may not be in the interest of the United States as comparative advantage strengthens cost and price structure. Using imports to fill supply gaps will continue to be a feature of the U.S. market in its current state, with the caveat that changes to tariff exemptions could raise costs of imports from Canada and Mexico.
Figure 2: U.S. finished steel production & imports (Mt)
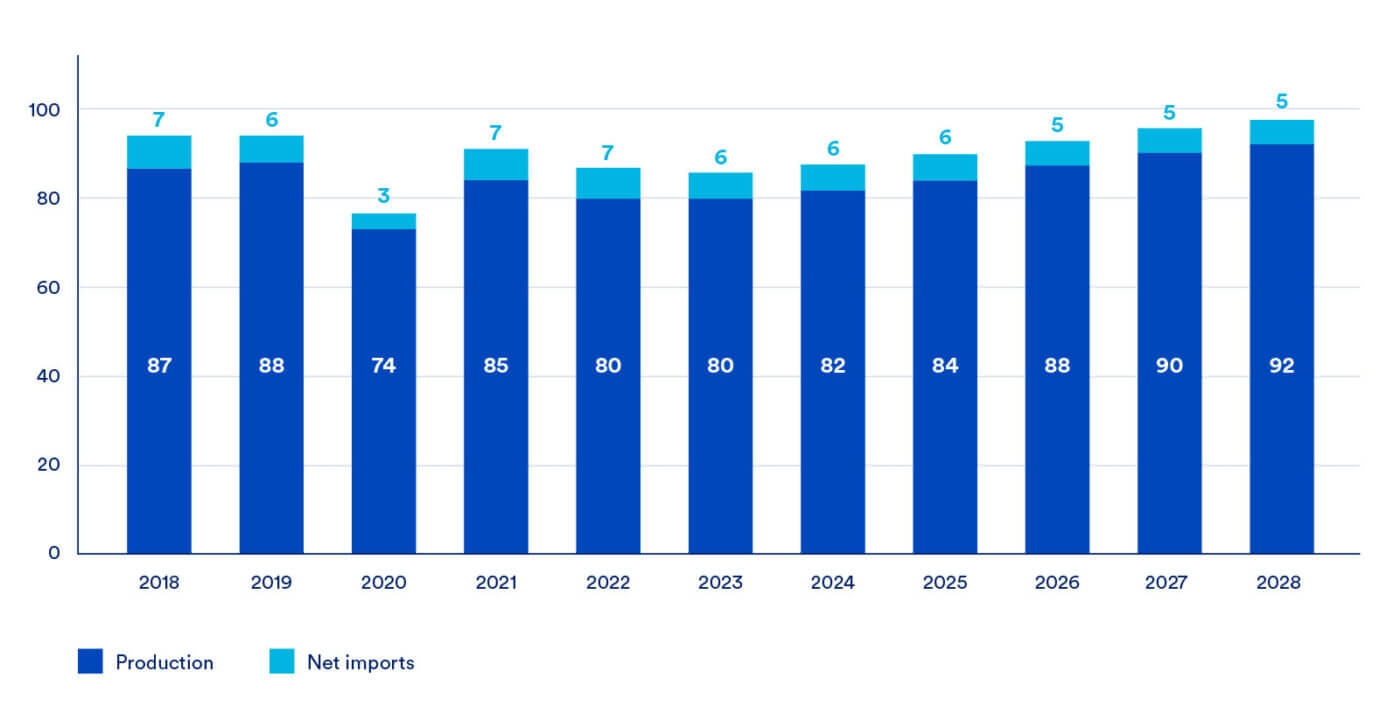
Note: U.S. production includes finished steel products.
Figure 3: Global steel trade flows9 (Mt) 2023
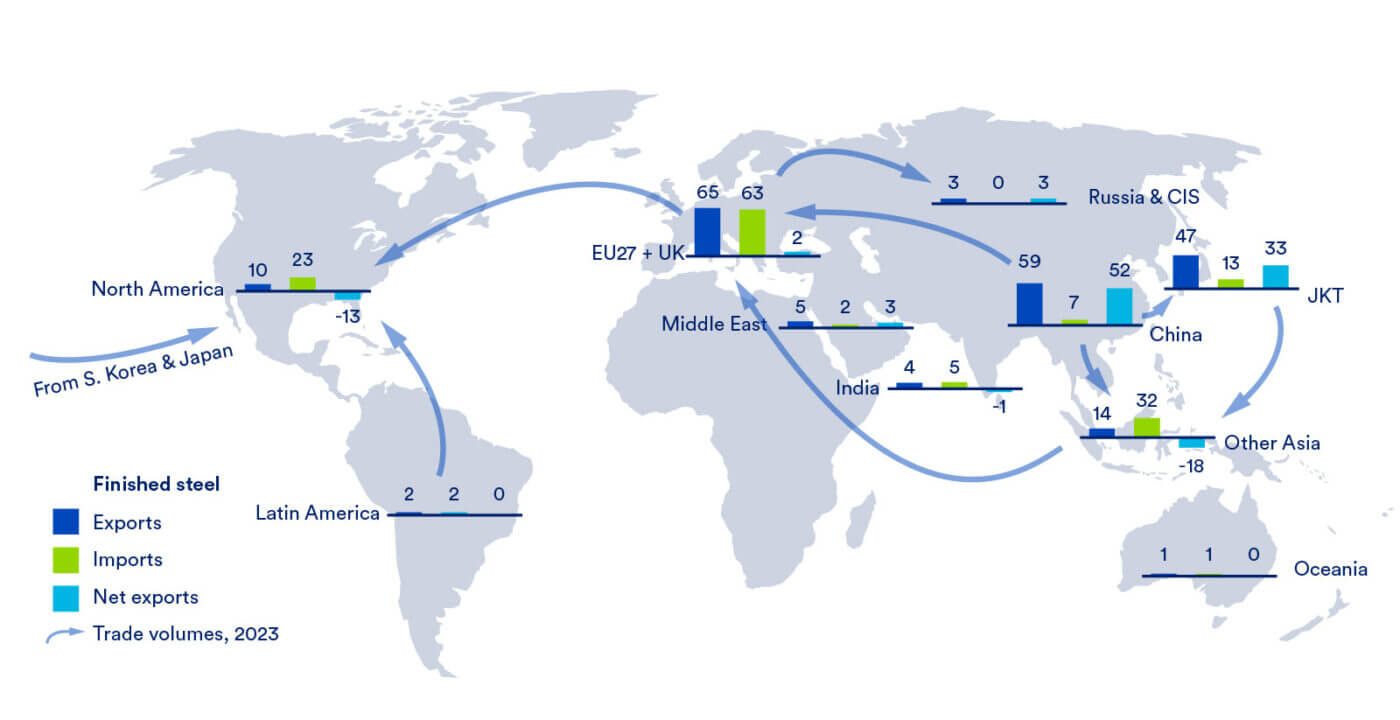
As the carbon intensity of U.S. steelmaking is amongst the lowest in the world, imported steel and ore-based metallics (OBMs, produced directly from iron ore) are likely to have been produced via a more carbon intensive process. As a result, supply gaps in the steel value chain increase scope 3 emission levels for U.S. steelmakers that import these materials. Domestic content requirements of the Build America, Buy America Act10 will motivate reshoring, thus reducing import reliance, but its success is dependent on the replacement strategies steelmakers implement. If quality and origin standards drive the construction of new, domestic production capacity for OBMs, then emissions reduction will be realized. However, if scrap or OBM imports are used to fill the supply gap, the U.S. will effectively be importing foreign emissions, negating any climate benefit. Some regions (particularly Canada and the EU) are moving aggressively to reduce carbon emissions in steelmaking, which could alter U.S. trade flows to be more focused on reducing the average carbon content of the steel purchased.
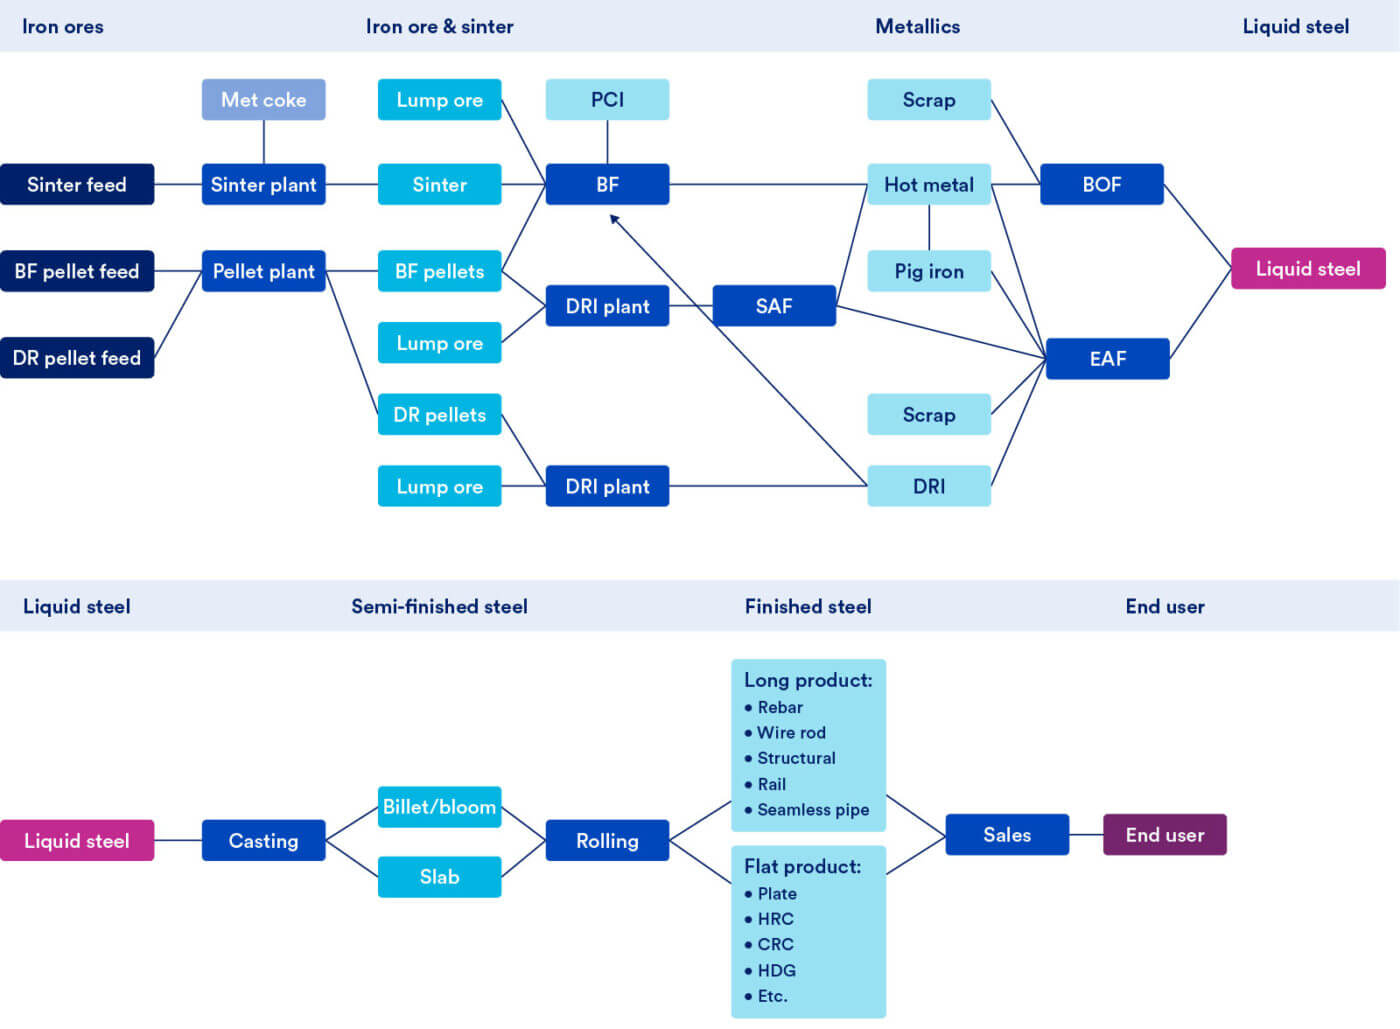
The following illustrations depict the steelmaking value chain: iron ore production followed by the ironmaking process (hot metal/pig iron and direct reduced iron (DRI)/hot briquetted iron (HBI)), and finally, the steelmaking process (via BOF or EAF).
Figure 4: Steelmaking value chain (left to right)11
Raw material processing methods
Production starts at iron ore mining and preparation, with some iron ore products requiring sintering or pelletizing before they can be used directly in a furnace. Compared to China, which uses sinter at a high rate, most iron units used in U.S. ironmaking are in pellet form. The pelletizing process differs between sinter, pellet, and other iron ore products as depicted in Figure 5 and can take place on site or at the mine, allowing for a more dynamic supply chain. Once transformed into its desired form, the iron ore is converted to liquid iron in a blast furnace to be used in integrated steelmaking; or is reduced in a direct reduction furnace to be used in EAF and submerged arc furnace (SAF) applications. Figure 6 and Figure 7 depict the ore to iron process.
Figure 5: Iron ore feedstock routes
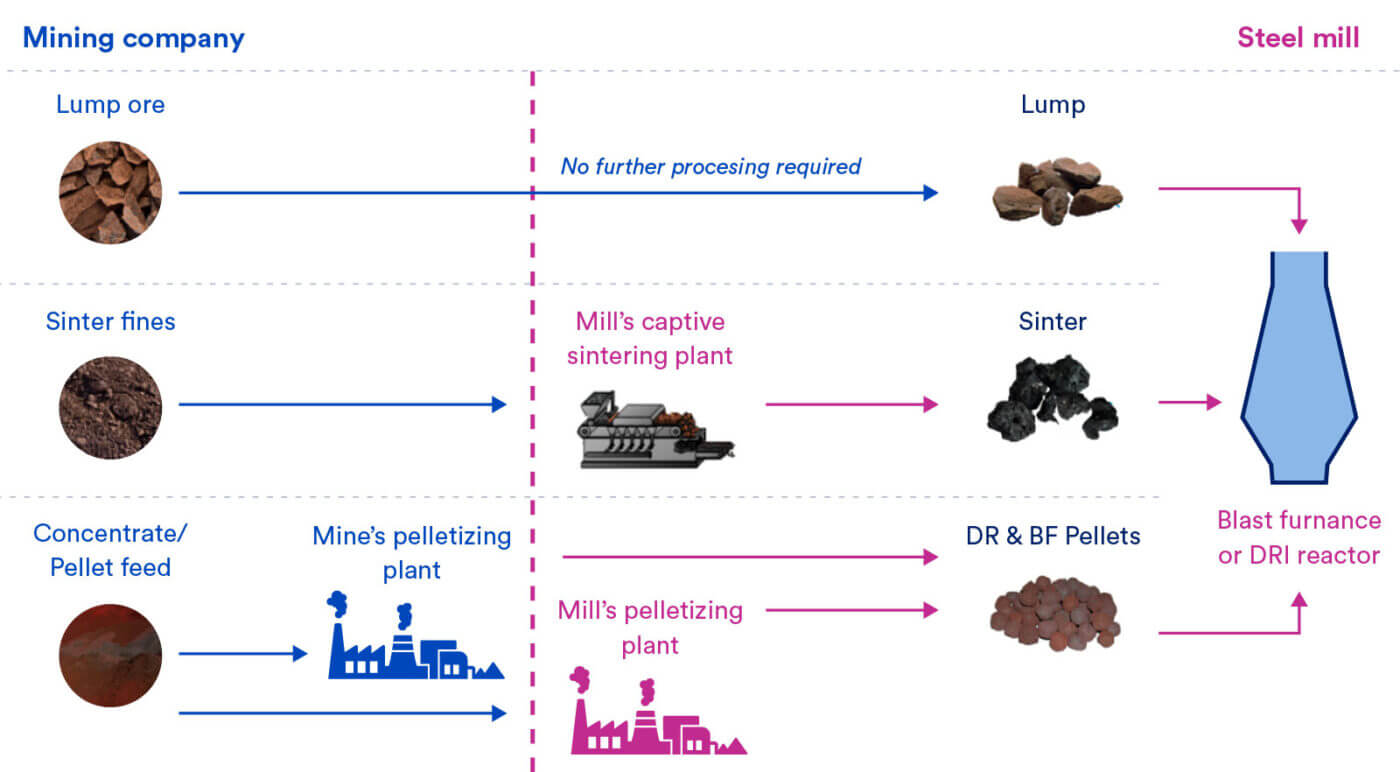
Figure 6: Liquid steel production in a blast furnace
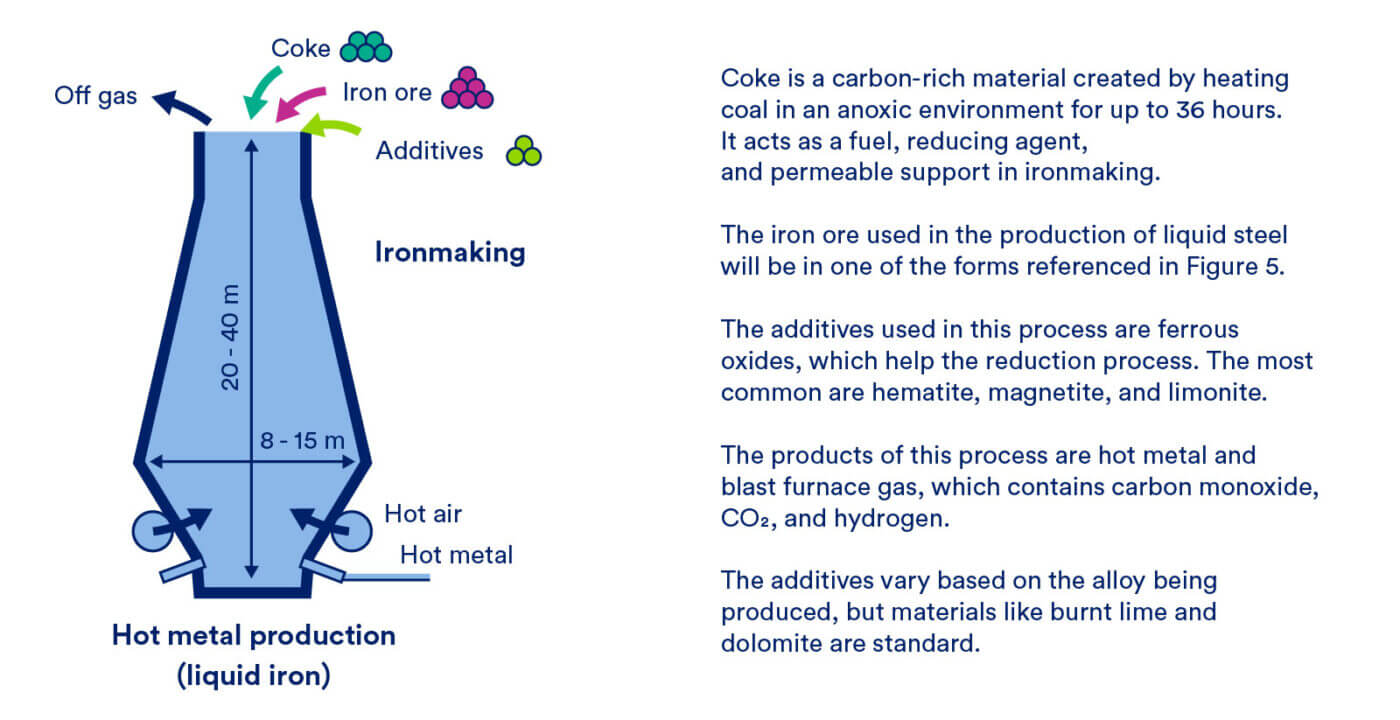
In blast furnace (BF) ironmaking, iron ore, coke (a coal-based fuel), and flux are continuously fed into the top of the furnace, while hot air is blown into the lower section to enable chemical reactions which convert (reduce) iron oxide to elemental iron. This hot air is provided by hot stoves, which are fired with the ‘blast furnace gas’ produced by the furnace (pictured later in Figure 31). The blast furnace reduces the iron ore and removes impurities in a single processing stage. This stage produces the clean, higher quality hot metal or pig iron that will be used in traditional integrated steelmaking.
The blast furnace is a continuous operation that is difficult and expensive to slow or shut down. The lack of flexibility in operating a blast furnace is a significant detriment to the process, as mills are reluctant to take a furnace off-line during times of low demand due to the difficulty and cost of intermittent operation.
Figure 7: Direct reduced iron production
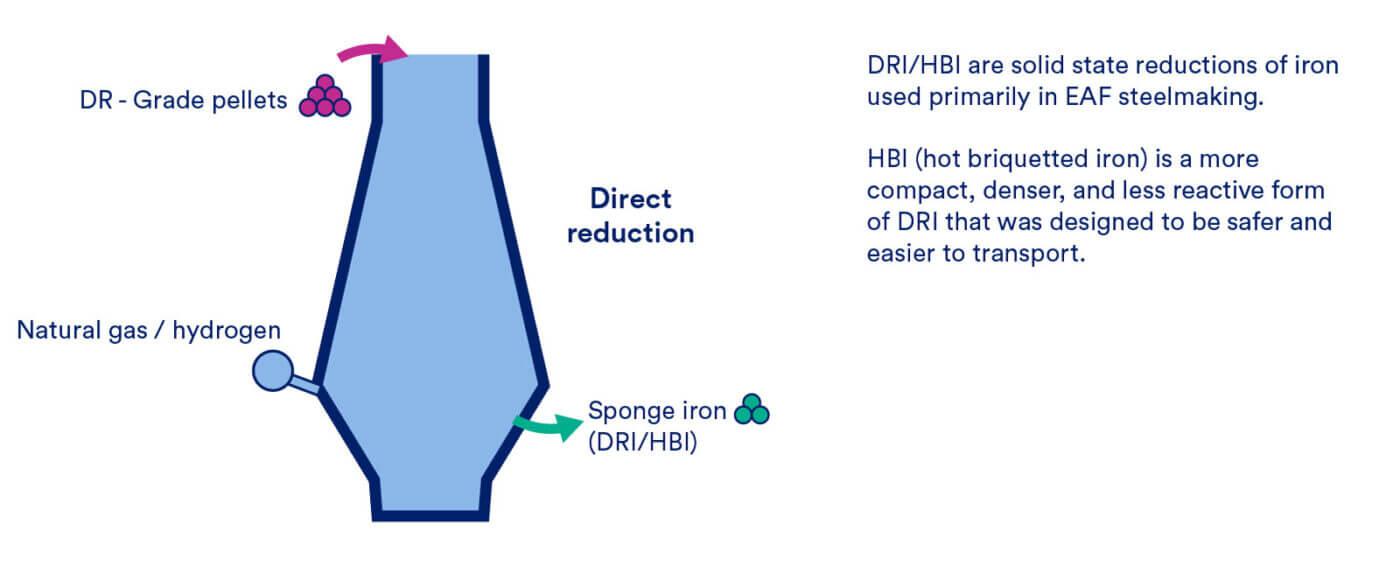
The direct reduction process differs from a traditional blast furnace in two key ways. First, the iron source for direct reduction, DR-grade pellets, needs to be of a much higher quality (67% Fe minimum). There are diverging pellet value chains, producing “high quality iron” at, or above 67% Fe, and regular or “low quality” iron below that level. These quality requirements are relatively inflexible, and facilities which choose to convert to DRI-sourced iron units must therefore also invest in DR-pellet production or outsource to the global market. Second, while a blast furnace utilizes coke to remove oxygen from the iron source, DRI uses a reduction gas (generally a blend of hydrogen and carbon monoxide). Although coal can be used as the precursor for the reduction gas,12 in the U.S. natural gas is exclusively used, with methane converted to hydrogen and carbon monoxide in a process known as reforming.
In contrast to the molten iron produced by a blast furnace, the process creates a solid ‘direct reduced iron’ product (also known as DRI) with a high iron content (>92%). Because DRI is porous and reactive to water, it can be difficult and dangerous to transport. Hot briquetted iron (HBI) is a denser, more compact, and less reactive form of DRI. HBI is created from DRI by compressing the hot (>650°C) DRI product into briquettes upon discharge from the furnace.Compared to a blast furnace, it is easier to slow, idle and restart a DRI plant. This flexibility is useful for steelmakers, as they can take short periods of downtime during periods of low demand. Plants in the United States have always operated at full capacity as demand for DRI exceeds current capacity. If DRI capacity exceeds potential demand in the future, plants will prefer to operate at a lower level for a longer period rather than toggle operation.
Steel production methods
Traditional basic oxygen furnace (BOF) steelmaking, or ‘integrated’ steelmaking is the globally dominant steel production route. Integrated steelmaking is a method in which the liquid iron (“hot metal”) from a blast furnace is charged with a small amount of scrap or OBMs and then refined into steel by blowing pure oxygen into the melt. With high-purity hot metal consisting of over 75% of the charge, the quality and cleanliness of the steel produced by this route is unsurpassed, allowing this process to supply steel for the most demanding of products.
Electric arc furnaces (EAF) are the alternative processing route to the BOF furnaces used in integrated mills. They use electricity to melt scrap and OBMs like pig-iron and DRI to produce steel. EAFs are generally smaller than BOF facilities and service regional or localized markets. An EAF can produce steel using 100% scrap, but for non-basic grades of steel, such as those required for flat or special bar quality (SBQ) products, the addition of OBMs such as DRI/HBI is essential. This is because the level of residuals13 in non-prime scrap, and some prime scrap, are too high to maintain the desired melt chemistry for the desired output.
Figure 8: Specified residual limits for common finished steel products, % of melt chemistry (SBQ, special bar quality)14
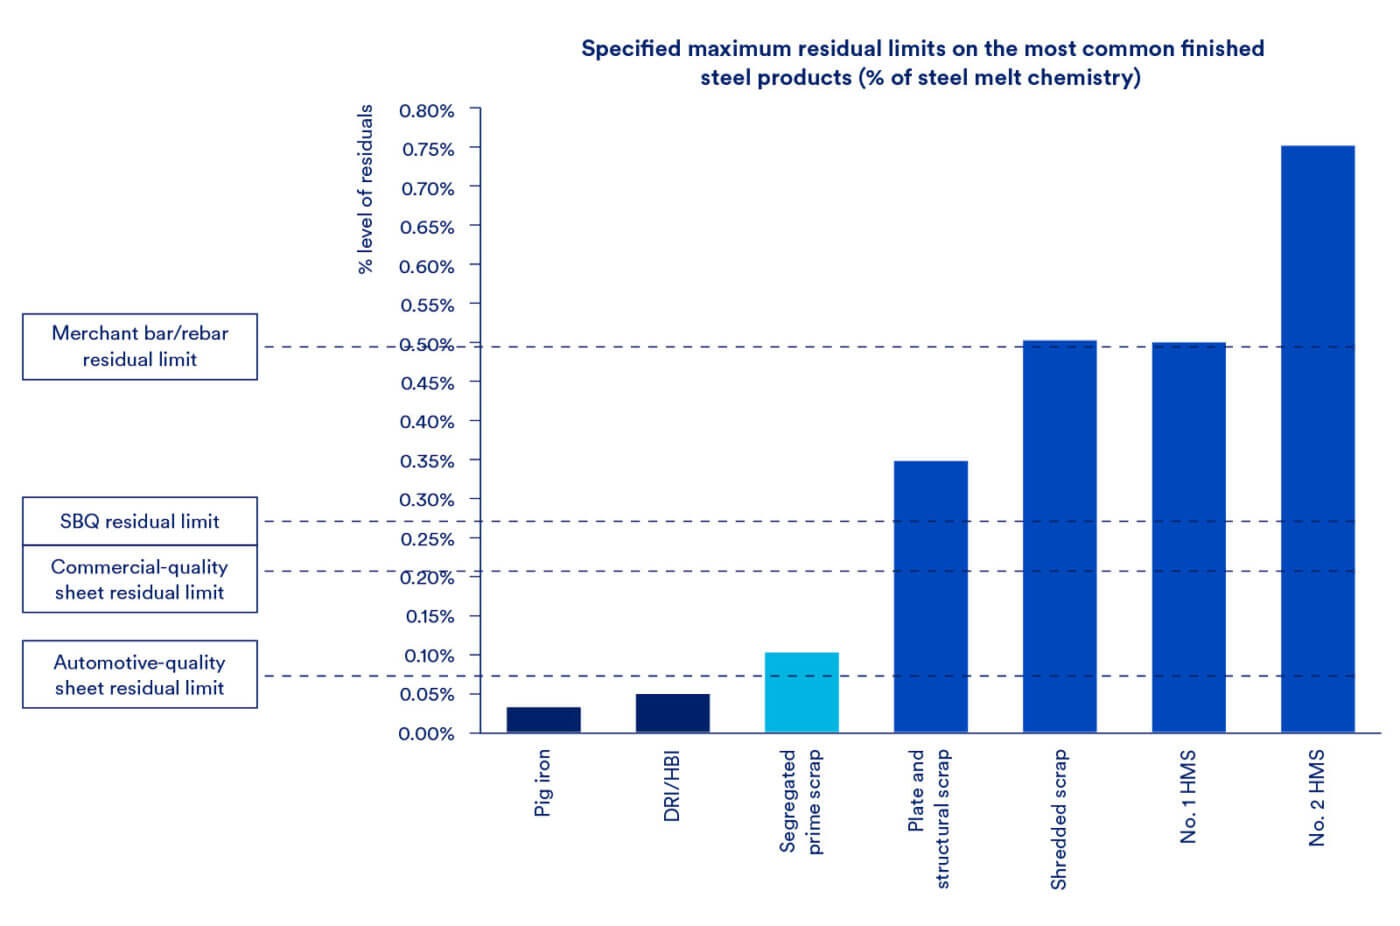
EAF steel value is directly correlated to the quality of scrap used in the steel-making mix. The quality of scrap consumed relates to its iron-to-carbon ratio, residual content, and the physical state or quality of the material. Thus, as EAFs increase their share of the market, the demand for cleaner, high purity scrap has risen. Not only does scrap availability restrict the expansion of EAF production, but increased scrap prices have incentivized mills to increase their DRI/HBI and pig iron consumption, much of which is imported. Continued growth in scrap demand will drive ongoing investments to increase collection and sorting efficiency, which will slightly increase the available supply of scrap; that said, there is likely not much more scrap to be collected. Later in the report, Figure 39 helps quantify the forecasted scrap availability and shows little to no increase over the medium-term.
Crude steel production capacity for EAFs in 2023 was 85 Mt, while BOF capacity was 24 Mt. Over the past ten years, EAFs have overtaken integrated mills to become the main steel production route in the U.S. Availability of scrap being a key factor in this change in production.
Table 1: Advantages/Disadvantages of domestic steelmaking production routes, 2024
| Advantages | Disadvantages | |
|---|---|---|
| BF/BOF | Low OpEx High productivity Excellent quality control Can produce most commercial steel grades | Less flexible operation High CapEx High CO2 emissions, particularly from coke production Reliance on coke supply |
| EAF | Flexible production Lower CapEx Less polluting Can produce small amounts of special grades cost effectively | Susceptible to scrap quality High electricity costs Steel quality control Cannot produce all grades using scrap alone |
Long product production is more suitable for scrap-based EAF production, while many flat products require higher purity melt provided by DRI or BF/BOF steelmaking
Steel products can be broadly categorised as ‘longs’ and ‘flats’, with differing production routes and applications. In 2023 the U.S. produced 80 Mt of steel from 8 integrated mills equipped with BF-BOFs, 85 EAF mills, and 3 DRI facilities. EAF mills were responsible for 100% of longs production and 50% of flats production, totalling to 70% of all steel produced domestically. BOF mills produced the remaining 30%, with all their activity focused on the flats industry.
Long products are the backbone of critical end use markets including construction, engineering, industrial manufacturing, transport infrastructure, and energy infrastructure. Examples of these products include rebar, wire rod, bar products, rail, structural steel and seamless pipes and tubes.
Produced via the rolling of hot steel into the semi-finished product known as ‘slab’, flat products include hot rolled coil (HRC), cold rolled coil (CRC), galvanized sheet, tin plate, welded pipe, tube, and plate. Flat products are more easily recycled, making them a key scrap input for EAF steel production. Common end use markets for flat products include construction, machinery, automobiles, infrastructure, ships, white goods, energy, and defense. Despite slowing growth in some HRC and CRC end-use markets, the products will see additional demand from developments in renewable energy as well as higher infrastructure spending. Wind turbines and solar installations are flat steel intensive, both utilizing up to 40-50%15 iron and steel in their fabrication and installation.
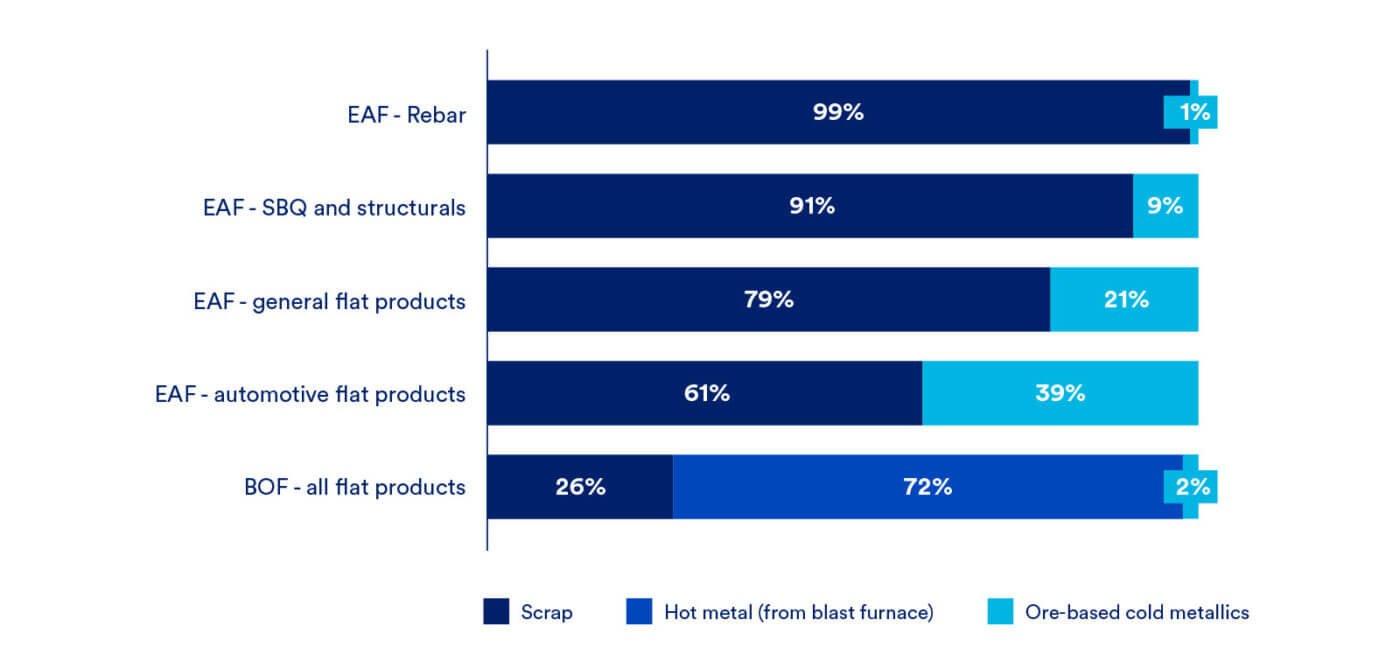
Figure 9 shows average raw material charges to meet the previously stated end-quality specifications. Within the five outlined product types there can be variation.
Figure 9: Raw material inputs for finished steel products, minimum acceptable limit, %
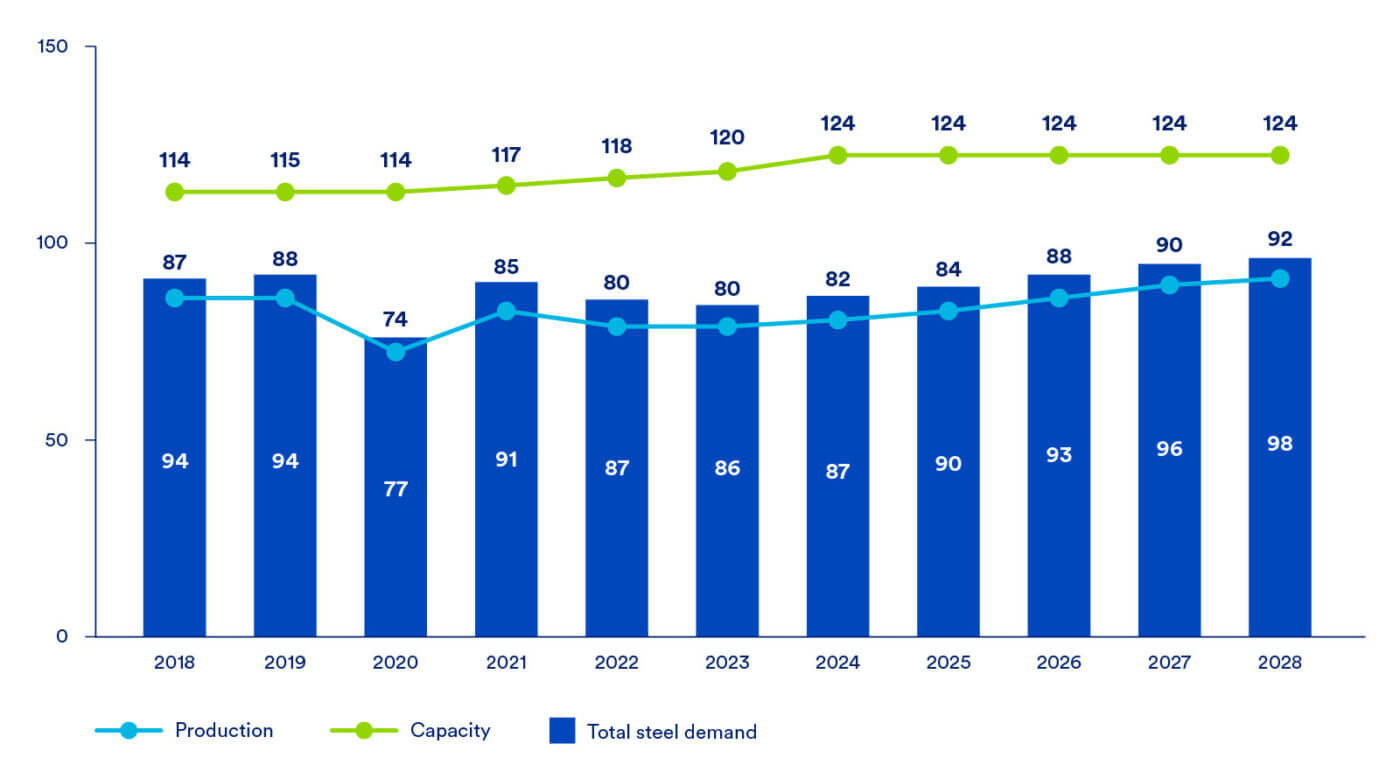
United States steel production has not historically met domestic demand, leading to its position as the largest steel importer in the world. The listed capacities in Figure 10 are likely overreported by steel producers, as utilisation has not exceeded 85%, even when the demand and prices for steel were relatively high. Due to the cost benefits from consuming steel products from countries with comparative advantages in certain products, the U.S. is the fourth largest crude steel producer in the world behind China, India, and Japan.
Figure 10: U.S. Crude steel production, capacity,16 and demand, (Mt) 2023
The U.S. has a strong pipeline of new steel production facilities under construction, with semi-finished steel capacity forecasted to rise at a compound annual growth rate (CAGR) of 4.5% over the next five years. In the flat steel market, the most notable of these projects will be U.S. Steel’s Big River 2 and Nucor West Virginia, both of which are EAF-only facilities, which will each add 3.0 Mt/year of sheet capacity, and ArcelorMittal’s Calvert EAF, which will add 1.5 Mt/y of slab capacity and displace imported slab at their Calvert finishing mill. Long product supply will increase, driven by new mini and micro mills and higher utilization rates at current operations. Whilst these increases in capacity will be low emissions, as they are largely scrap-based, they will have no impact on global carbon emissions. This is because they will be using scrap that is currently exported to international steelmakers. This will redistribute where emissions are produced (to outside the U.S.), not reduce them.
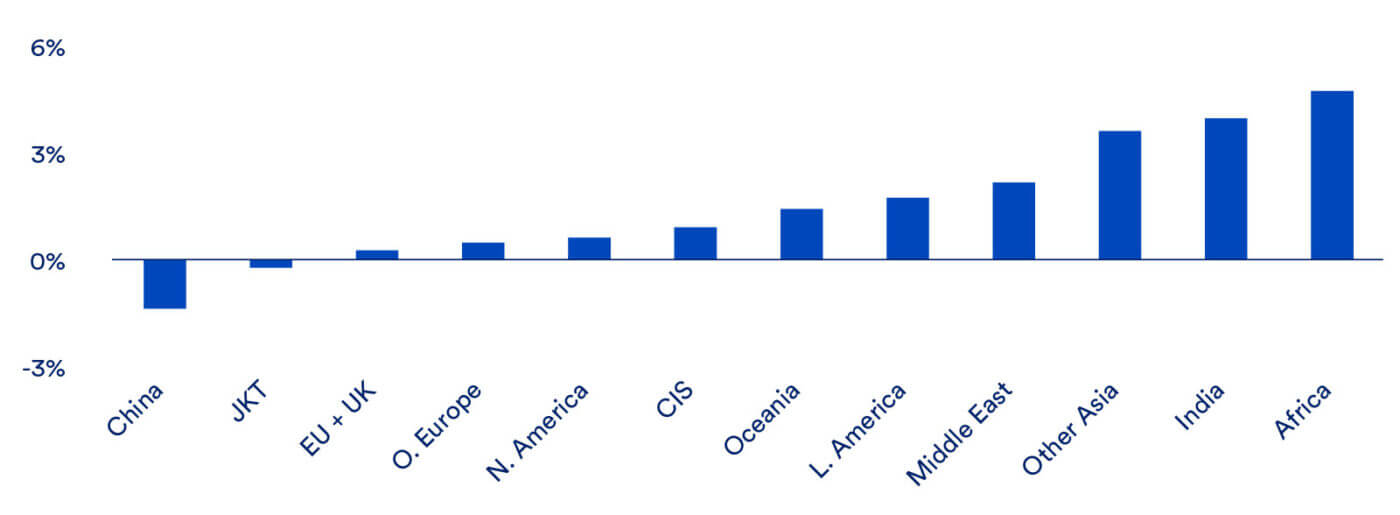
In the global landscape the United States will continue to be one of the largest steel producers. The implementation of carbon border adjustment mechanisms will place EU producers (who are struggling to compete with imports into the EU market due to domestic carbon taxes) on a more equal footing with imports, giving them a better chance to maintain domestic production. This may also shift the source of imports into the EU, as suppliers of low-carbon steel (such as the U.S.) will have an inherent advantage given a CBAM. China is expected to produce less steel over time as its domestic demand decreases. Chinese demand for crude steel will fall by an estimated 2% CAGR through 2028. Developing regions will experience the largest increases in demand and evolving trade patterns as countries strive to find the most cost-effective sourcing.
Long term steel demand growth to 2050 in North America is expected to be small, less than 1% year-over-year, and exhibit little change in its share of global demand.17 India and Africa will experience the highest growth in demand year-over-year, between 4-5%, contributing to an over 10% change in global demand by 2050. China, on the other hand, will see declining demand and a reduction in its share of global demand as it transitions out of an industrialization period and international trade policies tighten.
Figure 11: Long-term steel demand growth, y/y %
Steel demand historically tracked with economic growth
Steel has a wide range of uses and is key for economic development. The largest consumers of steel are the construction industry, followed by the automotive and manufacturing industries. As economies grow, the construction and transportation sectors both increase their respective outputs. Historically, the demand for steel has been tied to these industries as direct indicators, and CRU estimates these industries will continue to be the primary drivers of steel demand. The following chart shows the growth in these three sectors with global economic indicators: construction output, light vehicle production, and industrial production. Over the next five years the growth indicators all forecast positive year-over-year growth between 2-4 percent. The positive, yet moderate, forecasted growth for the economic indicators is reflected in the overall crude steel demand forecasts.
Figure 12: Global economic indicators, y/y change %, 2023
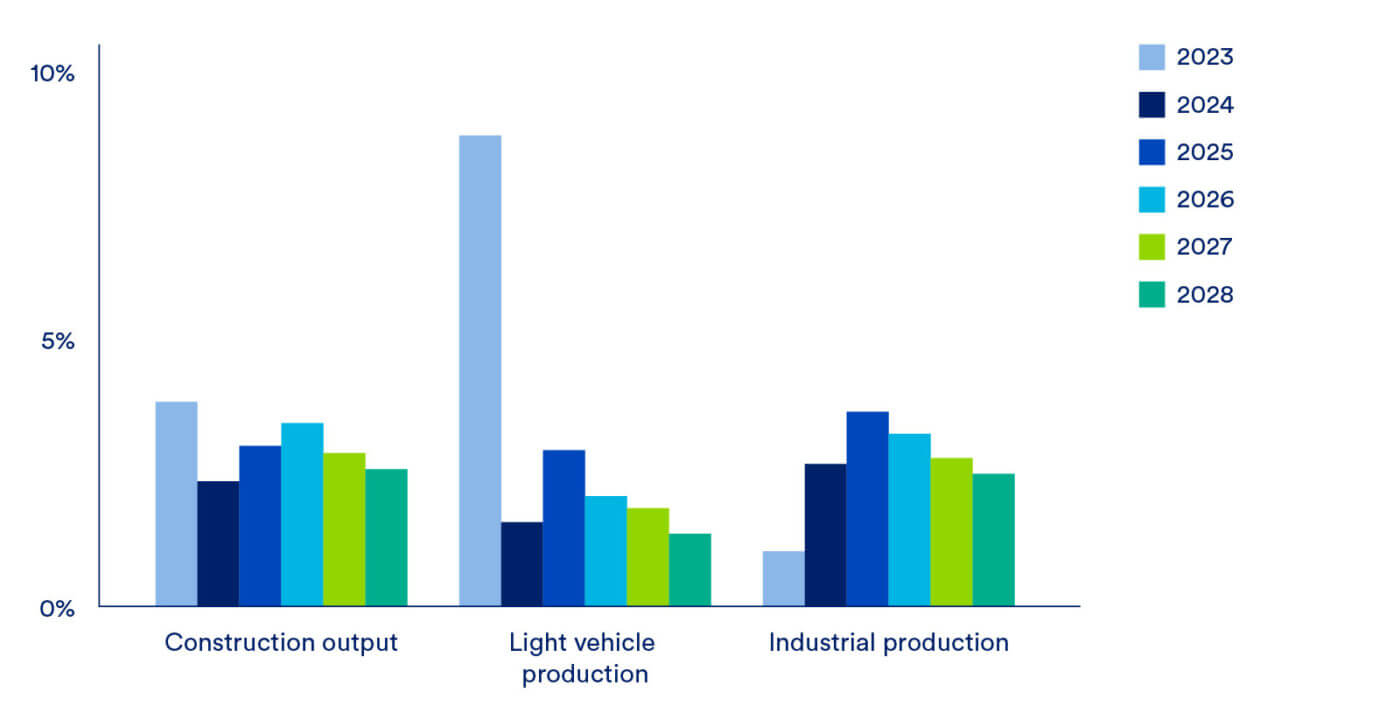
Note: CRU expects overall economic growth to be supportive of steel demand in the medium term as all main steel consuming sectors will expand between 2024–2028.
Other notable uses of steel include consumer goods and appliances, the energy sector, and electrical equipment. As countries around the world begin to decarbonize, other industries will experience slight increases in steel demand. The electrification of the transportation sector will bring about more electric vehicles that demand more infrastructure and energy related equipment. The development of the power grid and charging network to support the additional vehicles will require more steel. The production of more renewable energy will add to medium-term demand in the steel industry.
It is important to note that changes in demand that arise from decarbonisation and the green energy transition will not change the key historical drivers of steel demand. Wind turbines and (to a lesser extent) solar panel racks will drive some additional steel demand, but the amount is relatively small when compared to steel demanded from construction and infrastructure projects.
The U.S. steel industry is less carbon intensive than other major regions
Steel producers in the U.S. have some of the lowest CO2 emissions intensities in the world, as shown in Figure 13. This carbon advantage reflects the high share (~70%) of scrap-based EAFs operating in the U.S. as compared to ~30% for the rest of the world. The ability to operate this level of scrap-based EAFs is largely due to the U.S.’s mature economy, providing ready access to large volumes of scrap. China and Asia excluding China are the highest emitting regions, with Europe placed between Asia and the Americas. Steelmakers in Europe are actively making improvements to their steelmaking processes with decarbonization a clear goal of the industry.
Figure 13: Calculated scope 1, 2, and 3 CO2 emissions by region, t CO2 /t crude steel, 2023
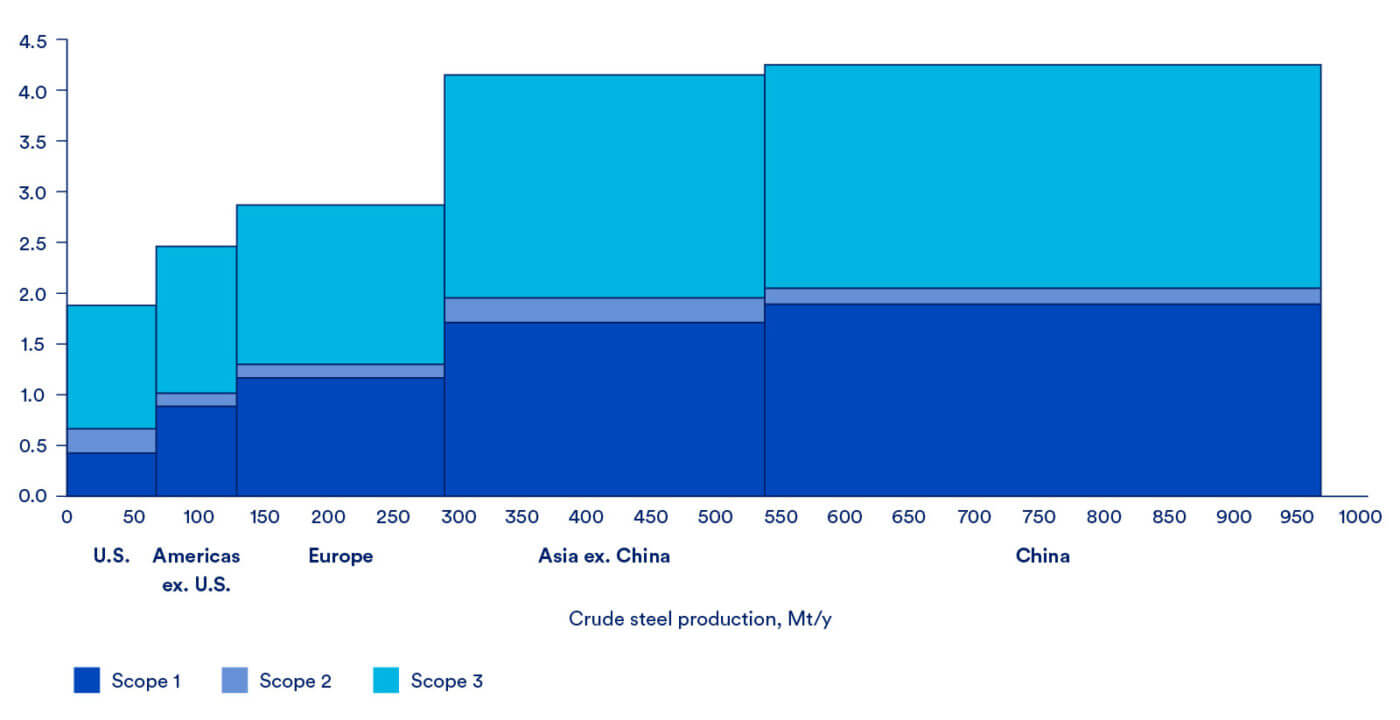
Note: Scope 3 emissions do not include upstream emissions from coal or natural gas production.
Figure 14 shows the differences in emission intensities between EAFs and integrated steel mills. There is a delineation in the emissions intensities of U.S. integrated and EAF mills. The separation between the two processes would be more drastic if only analysing scope 1 and 2 emissions. However, adding scope 3, which are defined as third party input purchases, provides a more accurate comparison. Readers should note that methane and CO2 emissions from the coal or natural gas supply chains, which can be quite significant, are not included in CRU’s scope 3 figures due to the large variability in potential emissions depending on source of fuel and assumptions. See Section 11.2 for a discussion of these emissions and their impacts. CRUs methodology and definitions for each scope are included in the glossary.
Specific emissions for the integrated facilities can be found in Figure 23. Amongst the EAF facilities there is more variation due to the quality of steel being produced, and these differences are outlined more clearly in Figure 28. EAF mills that are required (for quality reasons) to utilize OBM have higher emissions, specifically scope 3, as the iron reduction process is emissions intensive. The group of EAFs producing higher-quality steel and using more energy intensive inputs can be found in the middle of the figure below, between ~24 and ~46 Mt/y on the x-axis. EAFs located further to the left-hand side produce products that do not require OBMs.
Figure 14: Emissions intensities for U.S.-based steel producers, t CO2 / t crude steel, 202318

Note: Production is less than U.S. total due to omitted production of facilities without emissions data. Scope 3 emissions do not include upstream emissions from coal or natural gas production.
The following figure summarizes typical emissions intensities for both steelmaking pathways. Emissions intensities for EAFs are nearly three times less than the integrated mills. For an average EAF, scope 2 emissions are the most significant contribution, and are associated with generation of power. Switching to a clean electricity source could reduce the carbon intensity of the steel produced by roughly a third.
Figure 15: Average emissions intensity by scope, t CO2 / t crude steel, 2023
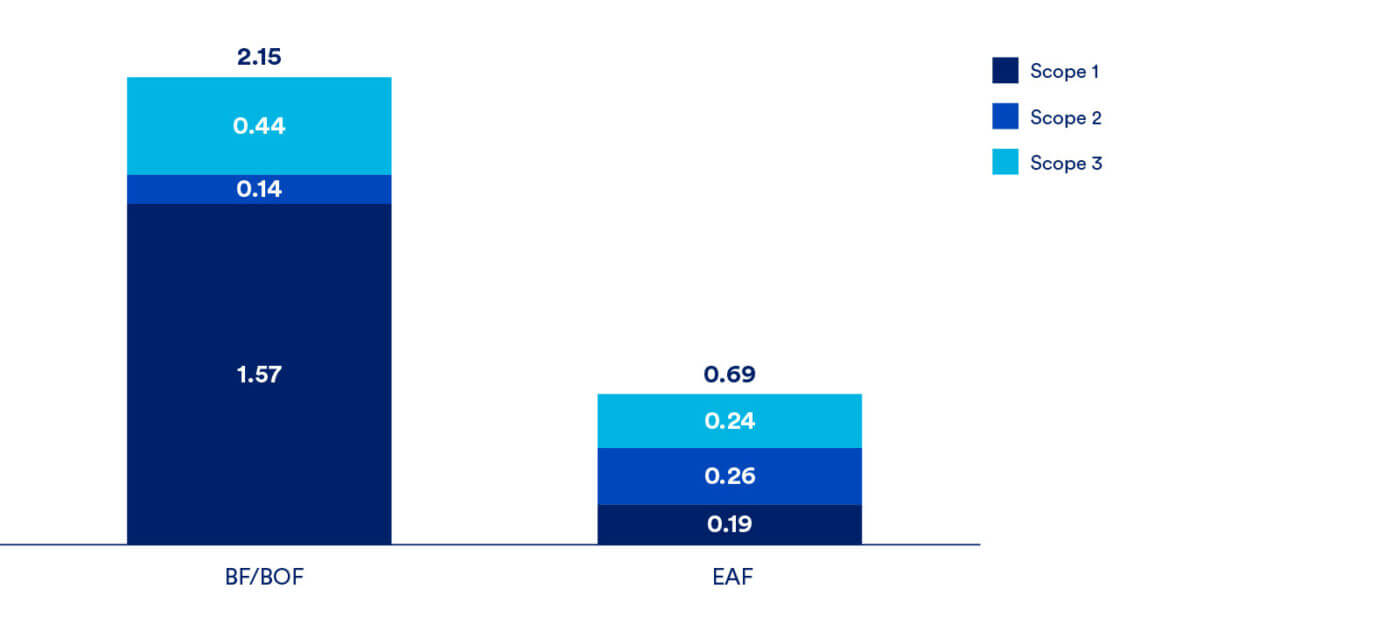
Note: Scope 3 emissions do not include upstream emissions from coal or natural gas production.
The primary difference between integrated mills and EAFs is in the lack of the carbon-intensive ironmaking process for EAFs. The figure below shows the relative sources of emissions for various iron and steelmaking processes. Integrated mills produce high emissions in the process of reducing iron ore to reach the steelmaking step, while EAFs start from steelmaking via the reuse of steel. The carbon intensity of scrap charged into the EAF is considered to be zero, even though most scrap originated from a carbon intensive integrated mill.
Figure 16: Relative scale of emissions for ironmaking and steelmaking pathways
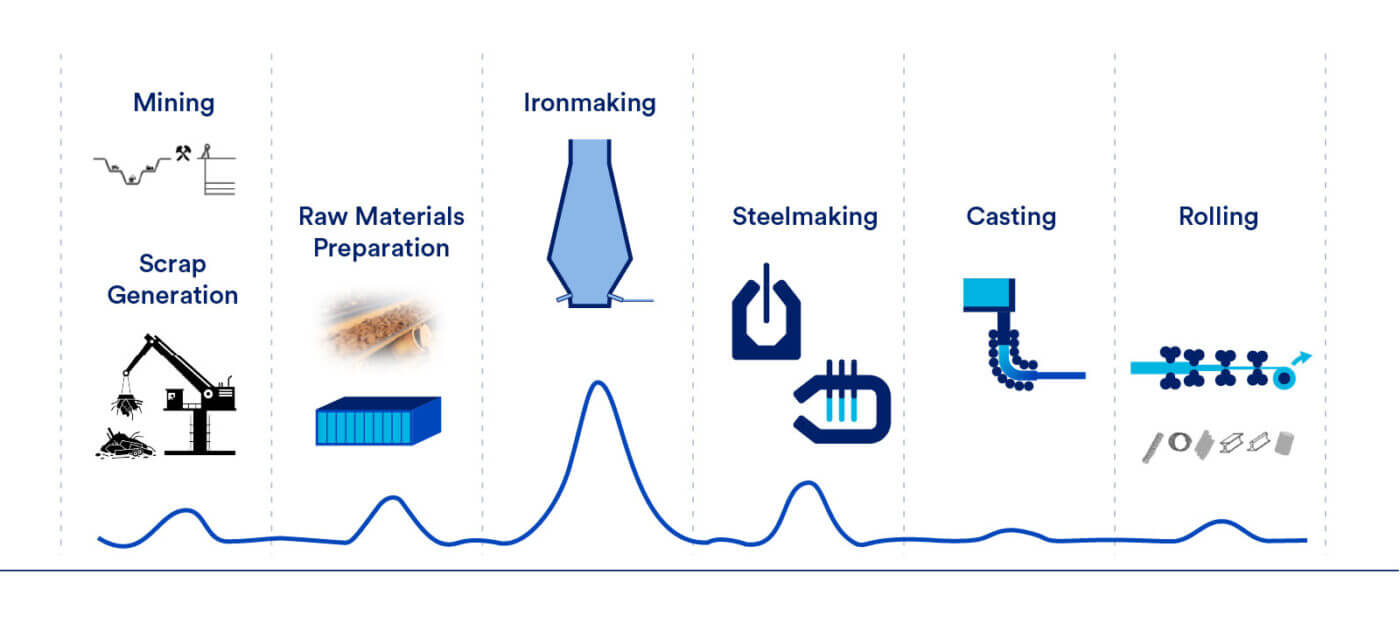
Note: Actual emissions by process are found in Figure 23 and Figure 28.
Raw material processing includes processing and transport of iron ore products. Raw material processing contributes 10-20% of total emissions. If a facility has an onsite coking plant, then the emissions from coking are also included. Most raw material processing emissions come from the coking and pelletizing facilities. Variation in emissions exists across facilities due to different raw material inputs.
Ironmaking is the primary driver for emissions related to steel production. Responsible for 40-50% of total emissions, the efficient but carbon-intensive blast furnace results in higher intensities relative to other processes. Emissions from ironmaking are a result of the reduction process.
Steelmaking is the process of converting scrap, OBM and liquid pig iron into the final, liquid steel of the desired chemistry. Steelmaking is more carbon intensive for EAFs due to the large energy demand, as much of the feedstock material is in solid form, whereas a BOF starts with mostly liquid iron. However, this value can vary greatly for an EAF based on the associated electricity emissions. EAFs using clean electricity will significantly reduce their carbon intensity.
Auxiliary and fugitive emissions are difficult to abate, and specific to a plant’s supply chain. Although these emissions, excluding those from the natural gas and coal supply chains, comprise a small fraction of total emissions while looking at all scopes, it remains a hurdle to reach net-zero steel production. For some of these processes, such as the production of burnt lime and dolomite, carbon capture could be implemented. Production of industrial gases (such as the high-purity oxygen needed for the BOF) is another example of a process that could decarbonize via the use of clean electricity. Most difficult to abate are fugitive emissions, which are greenhouse gasses which escape during industrial activities, such as mining ore. Since both domestic integrated producers operate their own iron ore mines, they have control over this step of the operation. New technologies which reduce emissions from direct emissions sources will lead to industry-wide carbon reduction, but they are costly. The steel industry in the U.S. is making progress towards adopting new technologies and processing capabilities as incentives evolve. Integrated mills and EAFs in the U.S. continue working toward lower emission steel due to potential emissions standards and evolving consumer preferences. A transition to low- or zero-carbon steel will depend on the primary steel supply chain reducing emissions across the entire steelmaking process.
U.S. steelmaking has shifted over time from integrated mills to EAF mills
Steel production in the United States is largely carried out by EAF facilities, but this was not always the case. The traditional steel making route utilizing blast furnaces represented most of the production until 2005. Standalone EAF production has lower CapEx and raw material costs due to its simplified supply chain, utilizing scrap, and high-quality iron to eliminate the ironmaking process partially or entirely. EAFs can choose their location more freely as they are not restricted by coal and iron ore supply, but instead by energy cost and product demand. Their supply chains are less constrained as scrap and HBI can be efficiently transported, and production is flexible as they can more easily start up and shut down as necessary, unlike a blast furnace.
The production of liquid iron in integrated steelmaking is responsible for most of the cost associated with the process. Most integrated steel mills in the U.S. are in the Great Lakes Region due to the proximity to iron ore and coal mines, which reduces transportation costs and risks from exposure to low-cost seaborne imports. The Great Lakes-centric supply chain creates synergy between ore producers and steel makers. Captive domestic ore producers sell almost exclusively to U.S. and Canadian mills, as pellet exports require shipping costs of over $30 per tonne of iron ore, reducing competitive advantage in foreign markets.
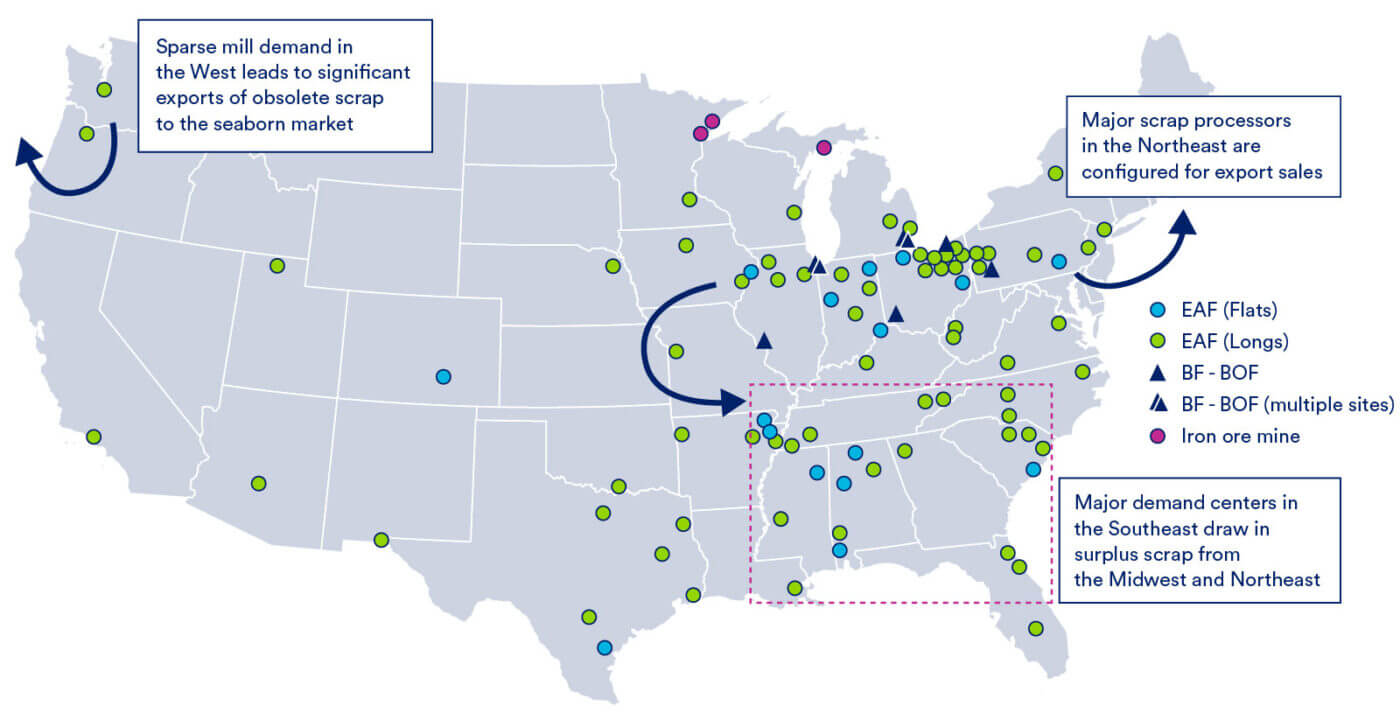
EAF locations are not constrained to the Great Lakes region because they do not source iron in the same fashion as for BF-BOF production. The locations of EAFs are influenced by scrap availability and local demand for steel products. As a developing industrial and auto manufacturing hub, the South/Southeast hosts major demand centers that independently generate scrap and draw surplus scrap from the Midwest and Northeast. Furthermore, growing activity in the South drove the expansion of the hot briquetted iron (HBI) market, which was created to improve the shipping quality and safety of DRI. Production capacity in the South is comprised entirely of EAFs, with the last blast furnace in the region idled in 2014 (U.S. Steel Fairfield) and replaced by an EAF. The southern United States will produce over 74% of total U.S. steel by 2030.
Figure 17: Major U.S. steel mills, 2024
EAF operators such as Nucor, Steel Dynamics, and Commercial Metals Company have invested heavily into scrap processing facilities. Using their own scrap as an input in the EAFs helps reduce cost, guarantee supply, and control quality. Last year Nucor reported that they recycled 18 Mt of steel scrap. Over 90% was used in their own operations with the remainder sold externally with the help of Nucor subsidiary DJJ, the largest ferrous scrap broker in North America.
The shift to EAFs took off in response to ideal market conditions which supported capacity expansions without disrupting cost flows or established supply chains. New EAF capacity additions continue to fill the supply gap resulting from BOF shutdowns in the Midwest. Additionally, EAFs continue to add capabilities to produce higher quality and specific grades of flat steel products. EAFs can match the quality of integrated steel production given the use of sufficient quantities of very high-quality scrap and OBMs.
Along with factors such as available scrap and favorable energy costs, the Southeast began to attract significant amounts of new manufacturing investment (including EAF-based steel producers) due to these states being “right to work,” reducing the likelihood of unionization. The new, low-cost, highly automated steelmaking capacity constructed in this region placed significant economic pressure on older, higher-cost (and higher emission) steelmaking, much of which was in the East and Midwest regions, leading many of these facilities to eventually shutdown.
Figure 18: United States BOF and EAF capacity, Mt
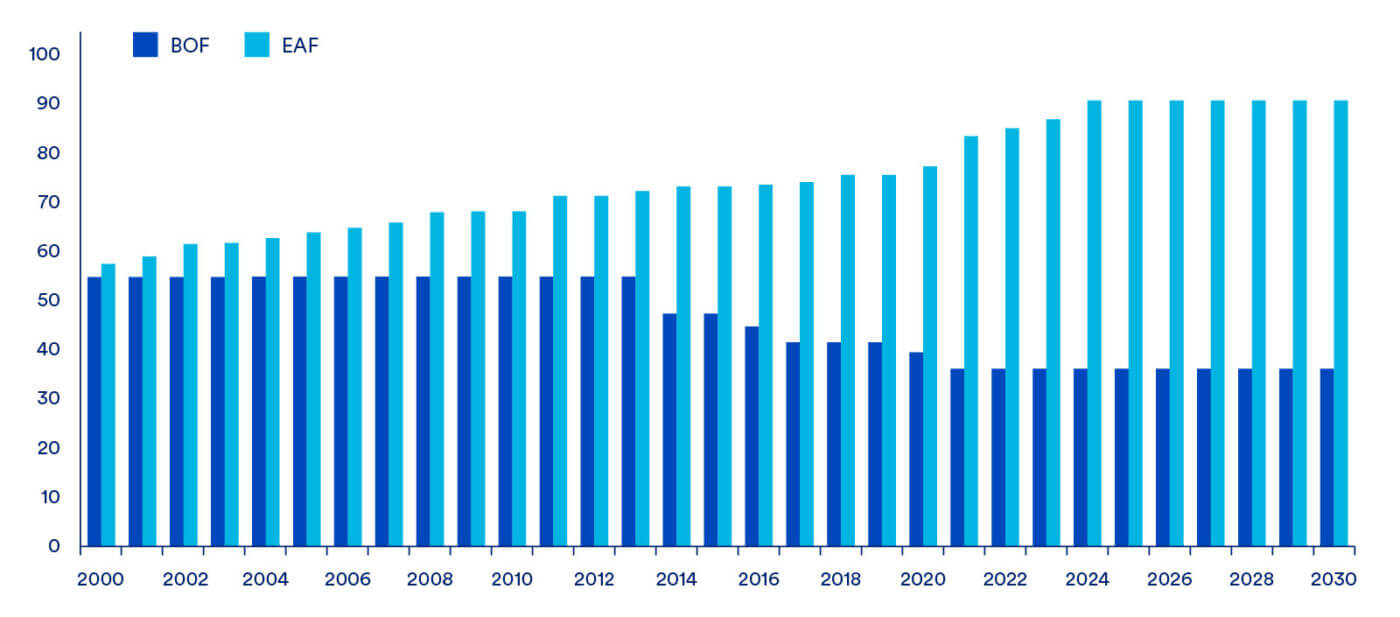
EAF steel production will continue to grow in the U.S., backed by competitive cost structures, available scrap, ESG driven decision making, and government support. Improvements in efficiency, cost, and production capability have bolstered EAF’s competitiveness in steel markets, most importantly, flat products. These mills will benefit from growing demand for steel and its use in solar, wind, and an upgraded electrical grid.
Integrated BF/BOF steel production facilities will continue to draw value from the well-developed Great Lakes supply chain
Figure 19: Distribution of U.S. BF/BOF facilities, 2023
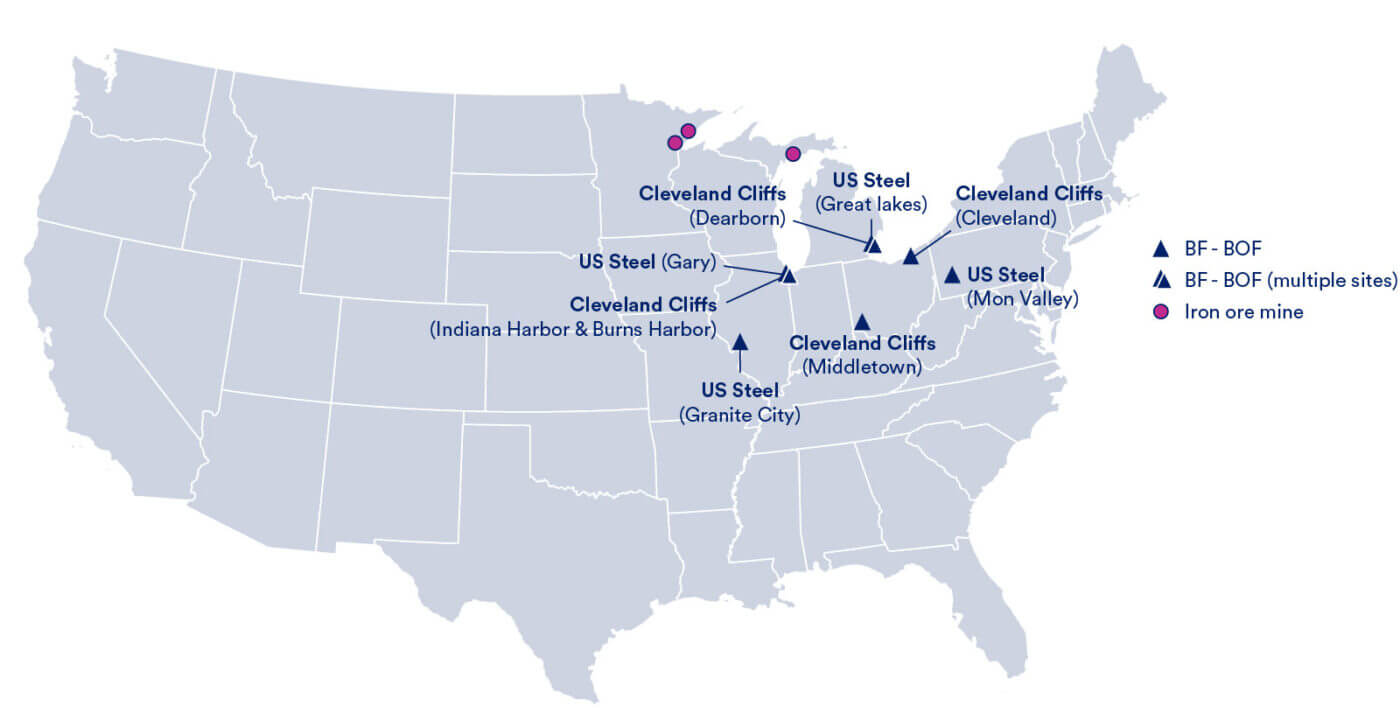
Note: Cleveland Cliffs Dearborn facility is limited to BF, BOF, and caster only. Granite City is idled indefinitely.
In 2023, the United States had eight integrated mills with iron and steelmaking capabilities. The U.S. BF-BOF market is controlled by two companies, Cleveland Cliffs and U.S. Steel, each of which have four facilities. Production from the eight active integrated mills totalled ~23 Mt in 2023, comprising 28% of annual production. Of those eight plants, U.S. Steel idled its Great Lakes facility in 2019, followed by its Granite City facility in 2023 (although both are still operating finishing facilities). While these two facilities are unlikely to restart, the potential acquisition of U.S. Steel could change operating plans, particularly with regards to Granite City. Each facility varies in configuration and size, but collectively they supply high-quality products with a range of end-use demands.
U.S. iron ore miners and U.S. steelmakers developed a co-dependency due to logistical difficulties and freight costs associated with pellet imports to the Great Lakes region. Domestic miners have faced little competition from external suppliers; however, these same issues make it difficult to export pellets. While U.S. iron ore miners benefit from this market structure and competitive advantage when supplying pellets to domestic customers, they are at a competitive disadvantage when attempting to sell product outside the region. The logistical barriers to enter the Great Lakes iron market allows the region’s suppliers and buyers to develop pricing mechanisms distinct from those in the international market. Cleveland Cliffs and U.S. Steel are both vertically integrated and operate their own iron ore mines that supply most of the iron ore used in their operations.
The following profiles summarize each U.S. integrated mill operation. Profiles are provided for the eight facilities that were active in 2023. Written profiles of each facility are found in Appendix 1: U.S. Integrated Mill Profiles.
Figure 20: Finished production split, Mt/y, 202319
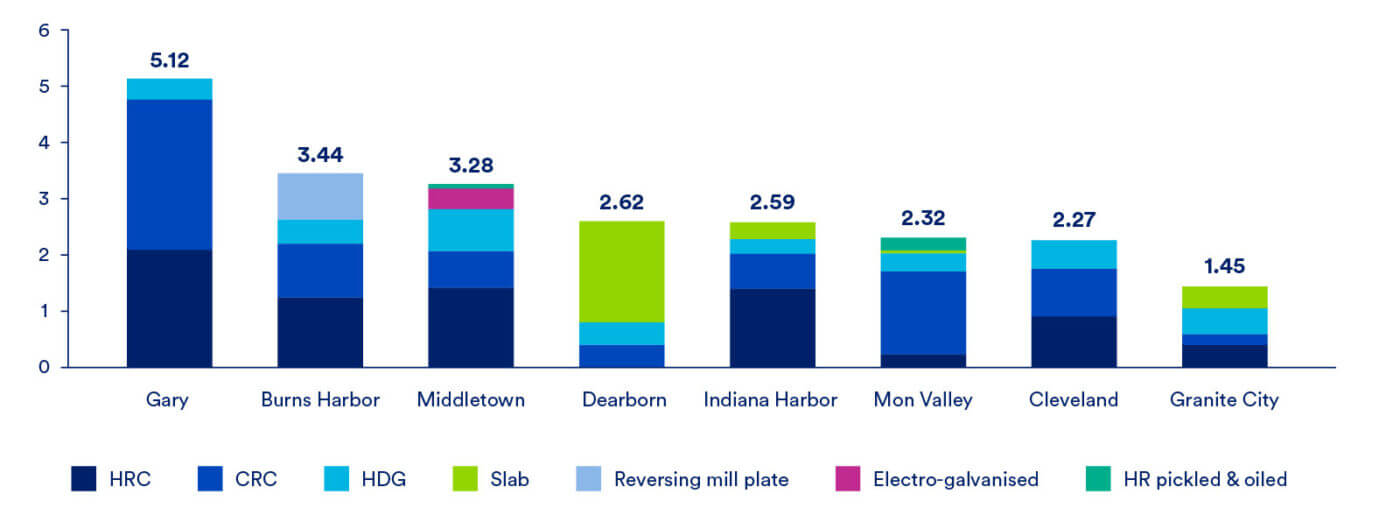
Figure 21: Raw material inputs, kg/t crude steel, 2023
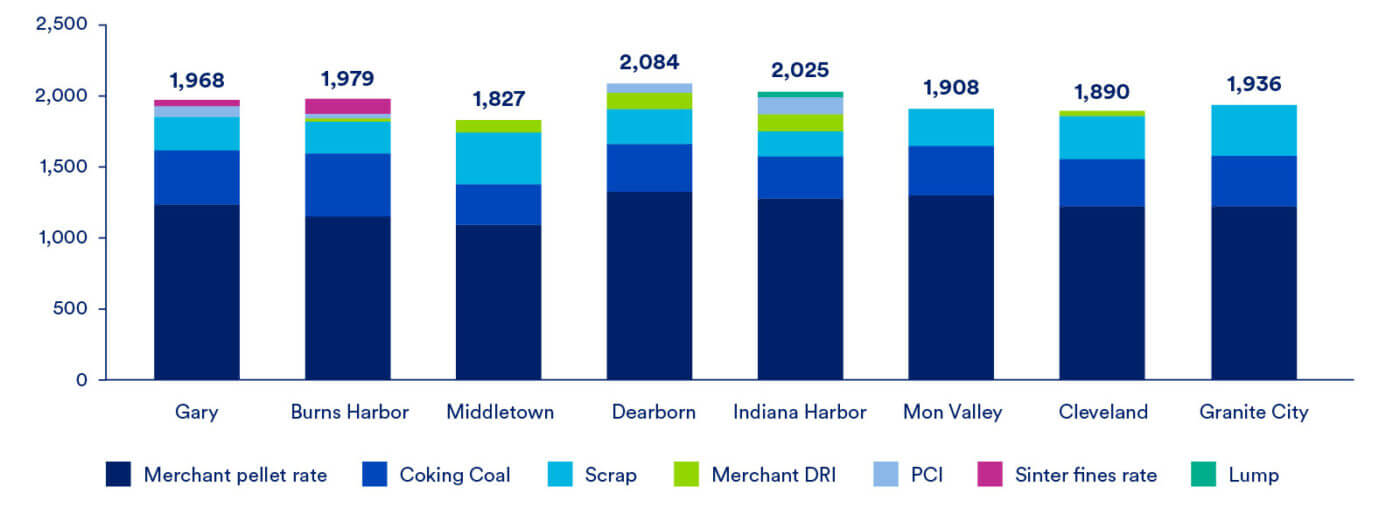
Figure 22: Site costs, USD/t crude steel, 2023
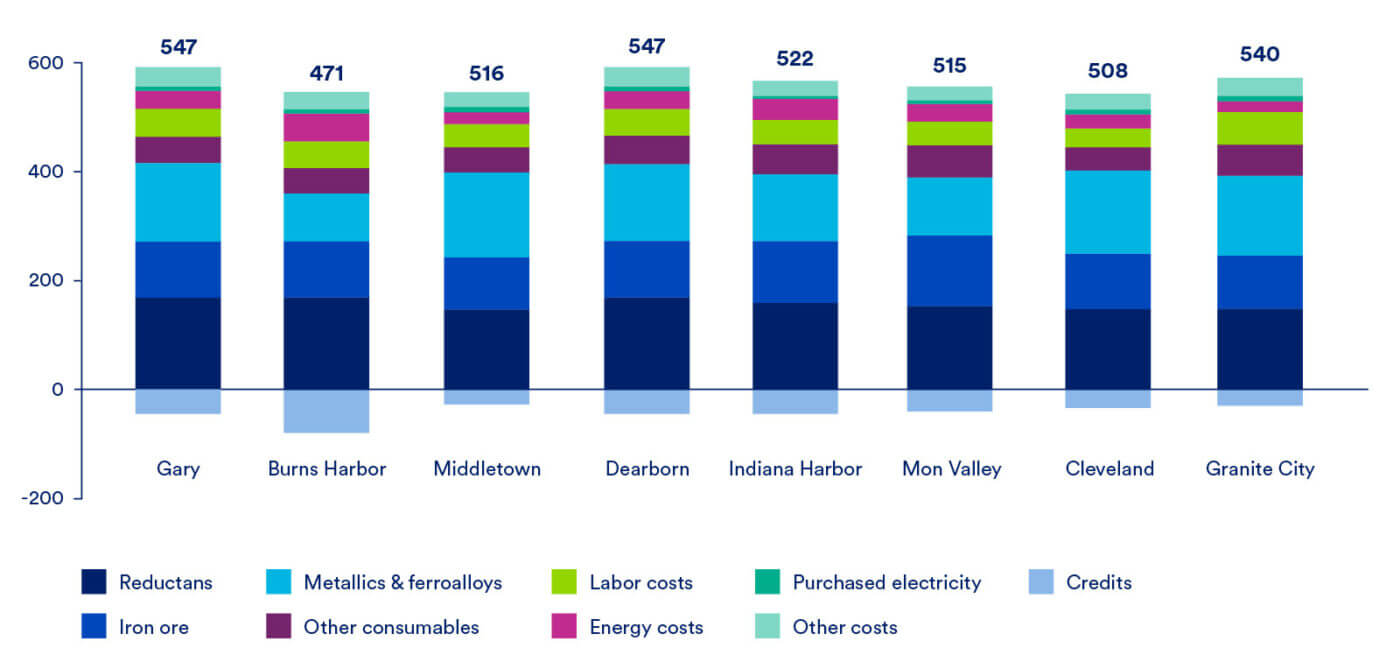
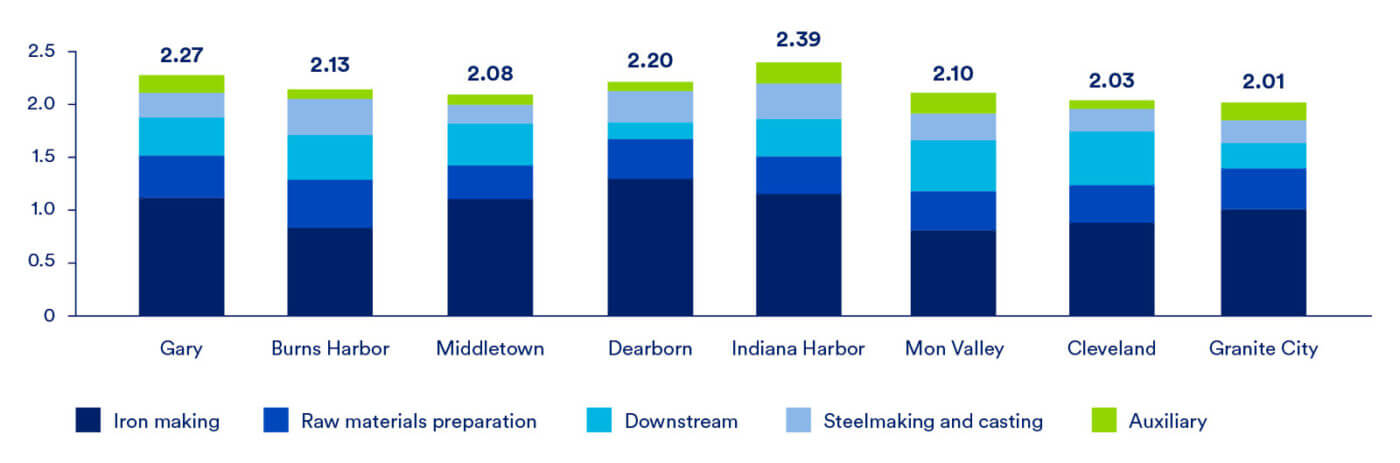
Figure 23: Emissions intensities20 by process, t CO2 / t crude steel, 2023
EAFs steel production facilities are distributed across the U.S. and less concentrated than BOFs
Figure 24: Distribution of United States EAF facilities, 2023
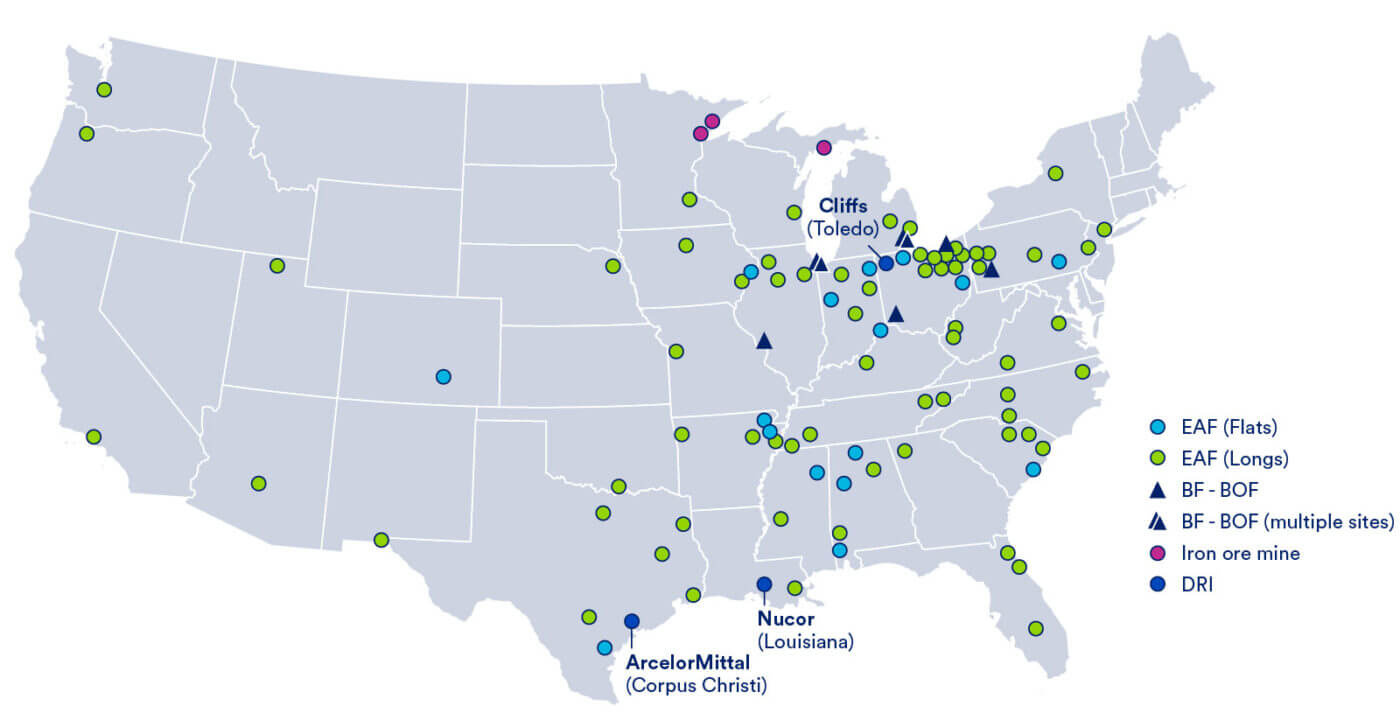
Table 2: Summary statistics for EAF flats and longs mills
| Product | Total mills | Capacity (Mt) | Final products | End use markets |
|---|---|---|---|---|
| Flats | 16 | 51 | Sheets, plates | Automotive, construction, transportation |
| Longs | 69 | 37 | Rebar, pipes, casts, bars, wire rod | Infrastructure, industrial, manufacturing, machinery, automotive |
The 85 U.S. EAF mills supply a larger and more diverse market than the BF/BOF producers. EAF steel production is the predominant route for the U.S., totalling 70% of the market. Unlike BOFs, which cover a wide product distribution area, EAFs are generally smaller and service regional markets. EAFs rely on the quality of scrap and the availability of OBMs used to meet product specifications. Higher quality metallic inputs (either high-quality scrap or OBMs) equate to higher melt efficiency, as well as higher-quality output. As an example, rebar is a relatively simple, easy to produce product with little in the way of chemistry requirements, allowing it to be produced in an EAF charged almost entirely with scrap, whereas flat products require a greater share of OBMs to produce high-quality steel with low residual elements.
CRU has identified five representative EAF mills to create a cross section of all U.S. EAF facilities. The selected mills show product diversity between flat and long production and subsequent end markets. Jacksonville and Jewett represent long product facilities with less variation in material input and end-product. The remaining facilities represent flat production with significant differences in production split and raw material inputs. Written profiles of each EAF facility can be found in Appendix 2: U.S. EAF Profiles.
Figure 25: Finished steel production, Mt/y, 2023
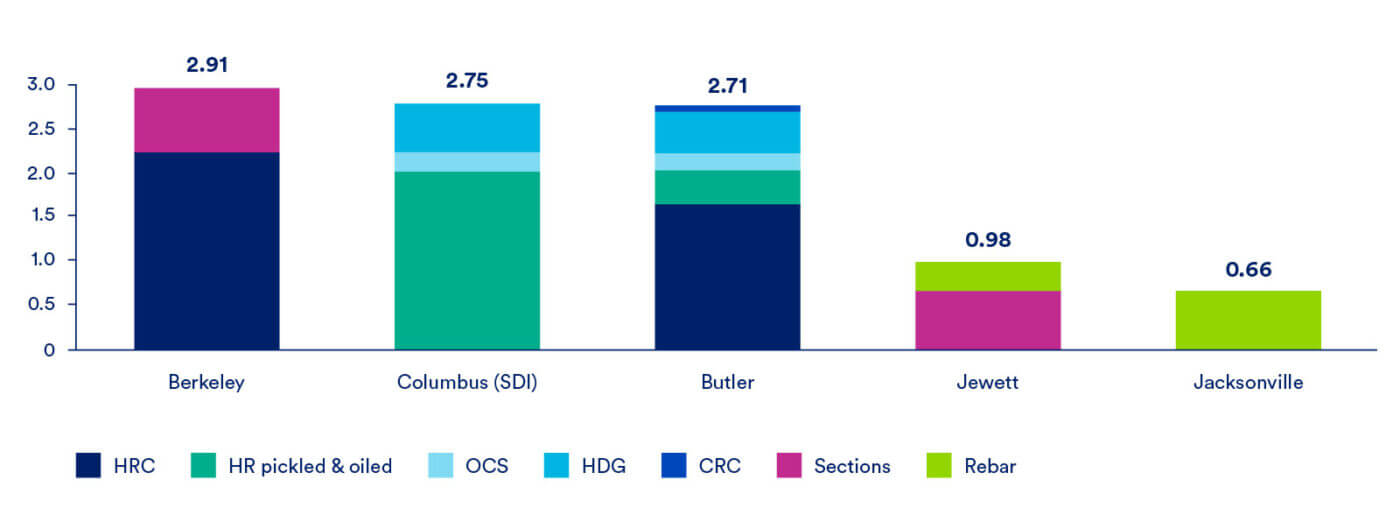
Figure 26: Raw material inputs, kg/t crude steel, 2023
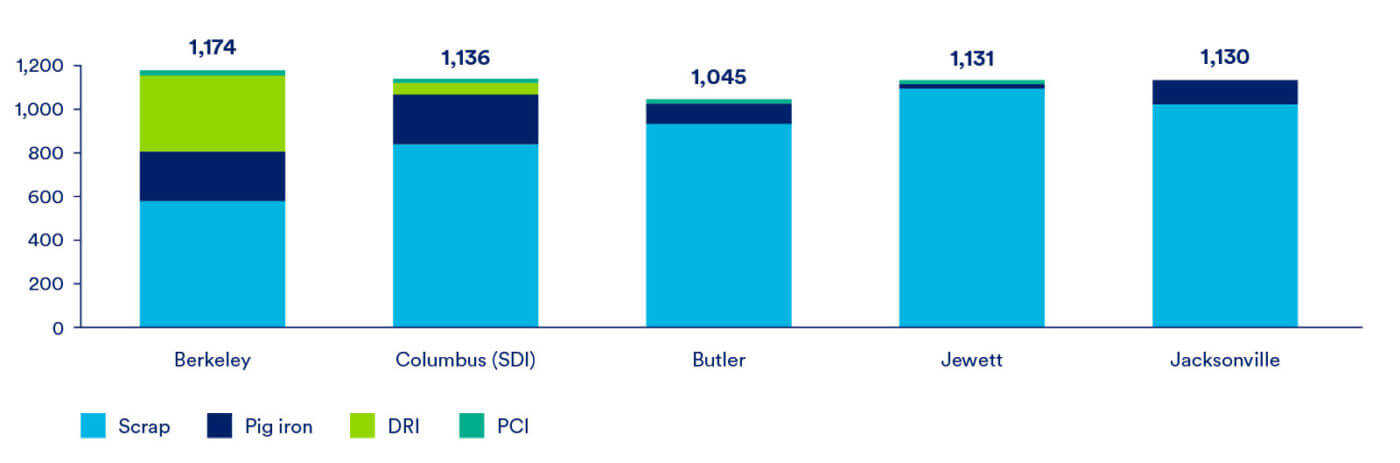
Figure 27: Site costs, USD/t crude steel, 202321
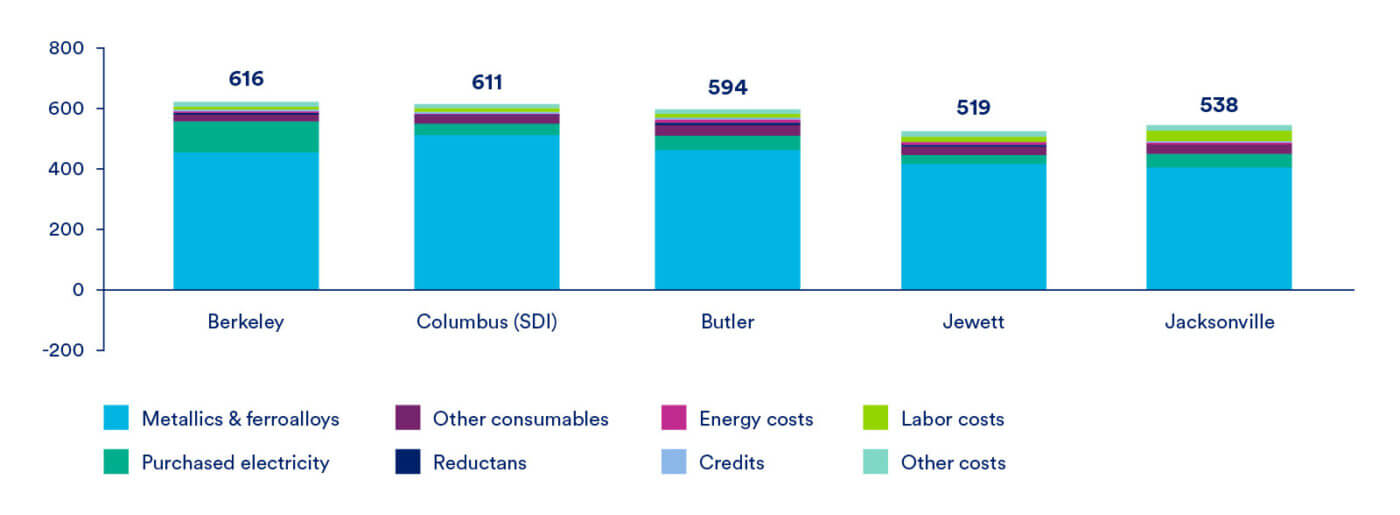
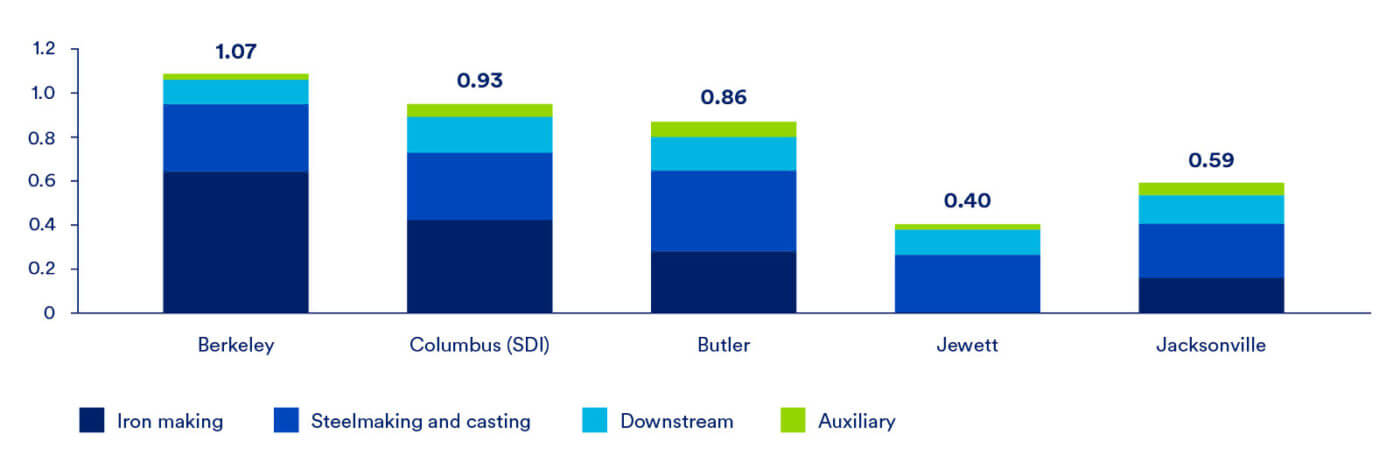
Figure 28: Emission intensities22 by process including scope 3 ironmaking, t CO2 /t crude steel, 2023
Product requirements dictate the charge-material mix for EAFs
Flat-rolled products generally require higher-quality raw materials than long products. Flat products consume OBMs at much higher rates, with charge percentages between 20% to 40%. The Columbus and Berkeley facilities utilize this elevated split. OBMs comprise 25% and 49% of Columbus and Berkeley’s charges, respectively. The Berkeley plant produces HRC to be used in the automotive industry, so their OBM consumption rate is high. Columbus is similar to Berkeley, but charges much less DRI and relies heavily on the use of high-quality, prime scrap.
Butler represents a unique class of EAF as it produces five different product types, both long and flat. It has the lowest raw material input due to access to high quality scrap from the Great Lakes region as well as a 0.35 Mt rotary-hearth type DRI/SAF plant.
The Jewett and Jacksonville facilities are longs producers. Both locations produce rebar, with Jewett differing in its production of sections for the construction industry. Despite similar product mixes, the Jewett facility uses nearly no OBM. The high percentage of scrap and lessened importance of OBMs allows these two facilities to have lower emissions compared to the flat producers.
The longs producing facilities are smaller than flats facilities. Smaller EAFs, less than 1 Mt/y, such as Jacksonville are gaining popularity and have received the title of “micro mills”. The rebar-centric production is reflected in the plant’s raw material mix, with over 90% of the melt being scrap. Scrap quality is not a major concern for rebar producing facilities, but still impacts the efficiency of the operation. Despite producing a lower-quality product, a small amount of an OBM – specifically cold pig iron – is charged in the furnace to increase efficiency.
Direct reduced iron provides a lower-carbon source of high quality metallics
Direct reduced iron (DRI) is an ore-based metallic (OBM) that plays an important role in decarbonizing the steel industry, as it provides new iron units with low impurities. This material can be used in combination with steel scrap in an EAF, charged into a BF to increase yields and reduce coke usage or remelted and refined in a submerged arc furnace (SAF) and then charged into a BOF. DRI has become more important as blast furnaces have been idled, as it provides the OBM units needed to produce high-quality products. As discussed below, domestic OBM demand has averaged roughly 30 Mt a year, a number expected to remain stable over the medium term. Most DRI/HBI is produced with natural gas as a fuel source and reductant, although with additional upgrades and expenditures, other fuel sources such as hydrogen could be utilized.
The combination of clean (low-carbon) electricity and low-carbon hydrogen could provide a near carbon-neutral iron product. Facilities such as Cleveland Cliffs Toledo have installed infrastructure that can utilize either natural gas or a mix of natural gas and hydrogen. The option to start with natural gas and switch to hydrogen as it becomes available makes DRI even more appealing and, combined with the availability of inexpensive natural gas, will make it likely that DRI will take share from blast furnaces as ironmaking facilities are upgraded.
Figure 29: United States DRI facility locations, 2024

Louisiana HBI
Nucor steel owns and operates the Louisiana DRI/HBI plant located in Louisiana. The plant has been operating since 2014, with an annual capacity of 2.5 Mt. The plant’s location along the Mississippi river allows for efficient distribution of material. Equipped with barge loading/unloading, the facility allows for deepwater ships to offload iron ore that is transferred to the processing plant. Once the reduction process is finished, the DRI is sent back to barges for distribution to steel mills.
The energy source for the plant is natural gas and utilizes the Energiron process as opposed to the other plants utilizing Midrex reduction technology. Energiron captures part of the CO2 in the off gas as a feature of the process, making CCS for this technology somewhat easier. Nucor announced a partnership with ExxonMobil to implement a carbon capture system at this DRI facility starting in 2026. The plan is to capture up to 800 kt of CO2 per year, or upwards of 65% of total carbon emissions.
Corpus Christi HBI
The Corpus Christi HBI/DRI plant is in Texas. The plant’s deepwater port allows for access to transportation routes throughout the Americas and globally. The plant was constructed in 2017 by Voestalpine using Midrex technology with an investment of $1 billion dollars. In 2023, ArcelorMittal acquired an 80% share in the plant, with Voestalpine retaining the remaining 20%. The plant has a nameplate capacity of 2.0 Mt/y of HBI, with production at 1.6 Mt in 2023. Voestalpine was previously using the HBI in their own steel operations, with offtake agreements in place that have since expired. During the acquisition by ArcelorMittal, a long-term offtake agreement with Voestalpine was created to supply an annual volume of HBI relative to Voestalpine’s 20% stake for its steel mills in Austria. The remaining balance is delivered to third parties and ArcelorMittal facilities. Current production utilizes direct injection of natural gas, but the facility can be converted to solely use hydrogen. ArcelorMittal plans to utilize green hydrogen DRI to deliver a decarbonized steel product but has not announced any firm plans for when the transition might occur. In 2023, the University of Illinois was awarded just under $4 million dollars from the U.S. Department of Energy’s (DOE) Office of Fossil Energy and Carbon Management, with ArcelorMittal as a subrecipient, to conduct a front-end engineering and design (FEED) study for a commercial-scale CCS project which aims to capture 95% of emitted CO2 from the HBI plant using a Pressure Swing Absorption (PSA) system assisted with Cryocap™ technology.23
Toledo DRI
The Cleveland-Cliffs Toledo direct reduction plant has been operating since 2020 and has a capacity of 1.9 Mt/y of HBI. The Toledo plant is one of the most modern of the U.S. direct reduction facilities and utilizes the Midrex process. Unlike the other direct reduction plants, Toledo is in the Great Lakes region; it utilizes domestic, HBI-grade iron ore pellets and transports material directly to Cleveland-Cliffs’ operations in the region. The operation is presently fuelled by natural gas, but the configuration allows for 30% to be replaced by hydrogen with no changes to the facility. With equipment modifications, Cleveland-Cliffs estimates that hydrogen usage could rise to 70%.
Middletown DRI (proposed)
In March 2024, Cleveland-Cliffs was selected to receive a DOE Office of Clean Energy Demonstration grant of “up to $500 million” to replace its Middletown blast furnace with a 2.5 Mt/y “flex-fuel” DRI plant and two 120 MW electric melting furnaces (EMFs).24 The DRI plant will be fed with lower-quality BF-grade iron ore pellets (sourced internally), with the solid, low-quality DRI melted and refined in the EMFs and then charged into the plant’s existing BOF furnaces. At startup, the DRI plant will be run using natural gas, with the option to switch to a mix of hydrogen and natural gas or hydrogen alone in the future. Cliffs claims a 50% reduction in carbon intensity using natural gas and 90% using green hydrogen. The total cost could be $2.1 billion, with the new facility requiring an additional 170 employees.
Pig Iron Metallics
A further opportunity to generate high-quality metallics involves the casting of ‘cold’ pig iron via a pig caster, which is fed with hot metal from a traditional blast furnace. This is an easy-to-implement process that has been performed routinely for decades. U.S. Steel recently installed a pig machine (capacity 0.45 Mt, $60 million, startup May 2022) at its Gary plant, with the pig iron offtake used in U.S. Steel’s EAF facilities. Pig iron sourced from an unabated blast furnace is a high-carbon raw material, leading to higher scope 3 emissions for EAFs that utilize the material. Equipping the blast furnaces at Gary with CCS would reduce the carbon impact of producing this cold pig iron, providing a high-quality, low-carbon feedstock for use in EAFs.
Carbon capture technology review
Carbon capture for integrated steelmaking
CCS requires the separation of CO2 from exhaust gases, allowing it to be transported and injected into deep geological formations for permanent storage. CCS can significantly reduce the carbon footprint of an integrated steel production facility, but the approach will be challenged as the level of desired decarbonization increases beyond a certain point. Integrated steel mills have multiple emission sources, requiring carbon capture to be installed at various points in the facility, each providing increased abatement, and increasing cost. The process off-gasses produced by a coke battery, blast furnace and basic oxygen furnace contain a significant amount of energy content. Various amounts of this gas can be used for heating processes within the plant, sold on the open market, or flared for safety or process configuration reasons. However, these off-gases are often routed to a power plant, where it is used to produce steam and electricity for use at the steel plant. The fact that these off-gases are routed to a central location allows for a large single point-of-capture for a CCS system.
Figure 30: BF-BOF CCS capture scenarios at 85% efficiency on the treated stream. Mt CO2, %
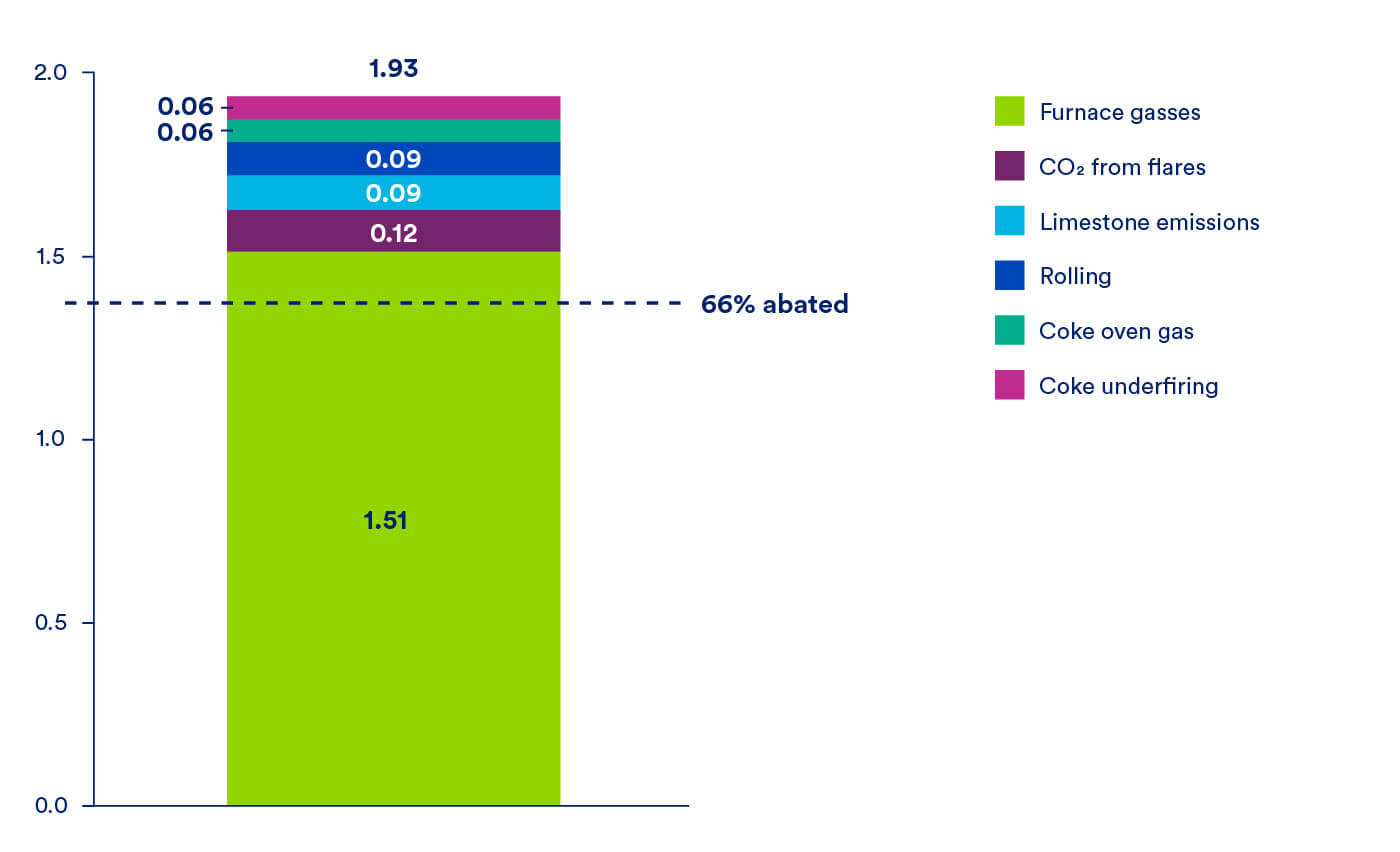
Note: Model assumed a 15% scrap rate and therefore may have higher direct emissions than a typical U.S. integrated mill. Excludes emissions from upstream coal production.
Figure 31: CCS installation points for BF-BOF integrated mill
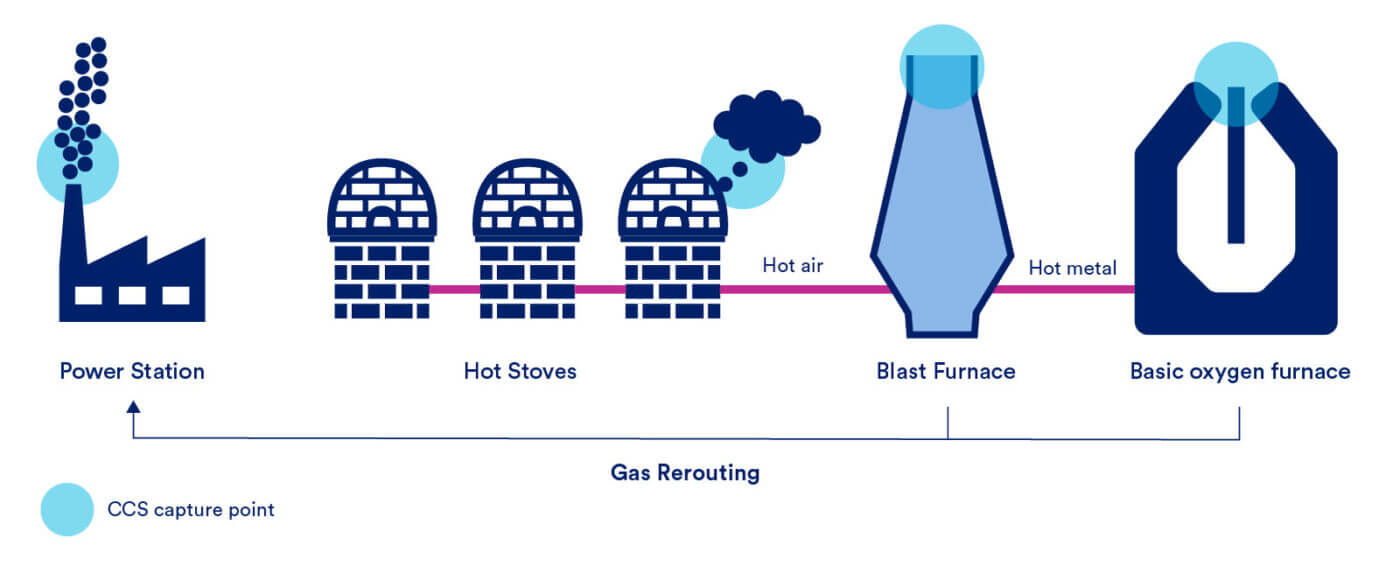
By maximizing the redirection of off-gases from the blast furnace and BOF to the on-site power station, and installing CCS at the power station (capture rate of 85%), integrated mills could abate up to 66% of their total direct carbon emissions as shown in Figure 30. Given that most, if not all integrated mills have a power station, this route will not be unique to a single mill or group of mills.
The blast furnace hot stoves represent another large source of CO2 emissions. However, a 90% capture rate on the blast furnace hot stove would only result in a reduction in total direct plant emissions of up to 20% due to their isolated nature. Unlike the furnace off-gases, hot stoves exhaust cannot be rerouted to the power station effectively; so separate capture equipment would need to be installed locally to abate their gasses.
The continuous and pressurized flow of gas direct from a blast furnace offers the potential for lower-cost separation of CO2(i.e., pre-combustion capture) but, by itself, a direct-to-furnace installation can only achieve a 30% reduction in emissions, based on blast furnace gas properties and available capture technology. Again, this approach would increase the required cost to reach full abatement as additional capture equipment would need to be installed on the other emissions points.
Although integrated mills could install CCS on their blast furnace off-gas system alone, CRU expects rerouting of carbon intensive off-gases to a CCS-equipped power plant to be a more cost-effective approach on a per-ton basis. However, ultimately, the desired rate of capture will vary according to internal goals and regulatory requirements and, if blast furnace capture alone can meet a mill’s abatement goals, then it will likely be the chosen approach.
In addition to the actual steel production process, thought needs to be given to ancillary facilities such as coke batteries, sinter plants and pelletizing plants (which provide iron ore pellets for both integrated and DRI plants). In the case that these facilities are not on site, they would require individual, separate carbon capture to fully decarbonize. The overall emissions from these facilities will be low and so the unit cost of necessary capture facilities will be high given scale economy effects. Thus, this route has not been considered here.
Carbon capture for natural gas and hydrogen DRI
The demand for DRI will continue to grow as EAF and SAF steelmaking require a steady supply of ore based metallics. Thus, the steel industry must address scope 1 emissions from DRI production that will comprise most of the EAF and SAF scope 3 profile. Although hydrogen-based reduction will likely be one of the long-term solutions to this issue, the speed at which this technology will be integrated on a large scale is likely to be slow, given costs, hydrogen availability and technology readiness. In this case, CCS is considered a potentially viable abatement method for DRI and blast furnace iron production as it could provide significant carbon reduction in the nearer term.
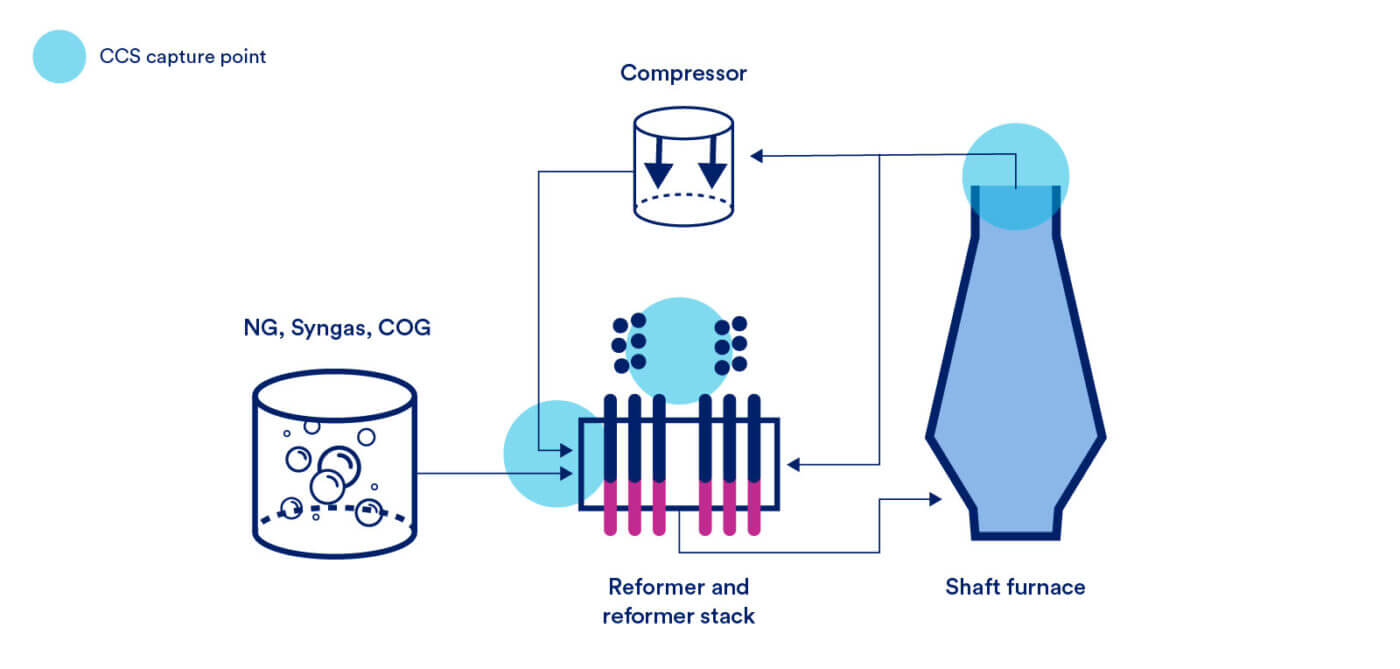
There are two main DRI production technologies, Midrex and Energiron, but how the CO2 is handled differs by process. In a Midrex facility, natural gas is first converted to CO and H2 in a reformer. Around 25% of the input energy is used for heating; the remainder is involved in the reduction reaction and so is contained in the process gas at the top of the shaft furnace or is contained in the product DRI (~15%). Process gas is scrubbed on exit from the shaft, and some is recirculated to the reformer as a heating gas, producing CO2 which is emitted via the reformer stack. The remainder of the process gas is mixed with the natural gas input to the reformer, where the CO2 content takes part in the reforming reaction to produce CO and H2. The proportion of process gas recirculated through the reformer is controlled to manage the stoichiometric ratio of inputs and optimise the process. Ultimately, however, all CO2 produced by the process is emitted via the reformer combustion stack.
In contrast, Energiron does not have a separate reformer and reducing gases are produced from natural gas ‘in situ’ in the shaft furnace. CO2 is removed from the process gas on exiting the shaft to control the CO2 level, before the remaining process gas is recirculated back into the shaft via a gas heater. Some process gas is also diverted to the gas heater before CO2removal to provide further control of the process gas composition. Thus, partial CO2 removal is an inherent component of the process, which makes CO2 capture of this component an easier option. Ultimately, ~65% of the CO2 is emitted from the process via the inbuilt CO2 removal system and 35% is emitted from the process gas heater combustion stack. The concentration of CO2 in the heater stack will be low and so would require larger, higher cost equipment.
If a plant is fitted with Energiron DRI technology, which captures, recycles, and utilizes furnace gasses to enhance efficiency, only a compressor and associated equipment would be required to reach ~60% CO2 reduction. Both Energiron and Midrex facilities can be modified to be 100% hydrogen adaptable, allowing for true net zero emissions in the long-term. Only one of the three plants in the U.S. is equipped with such technology, the Nucor Louisiana HBI plant, and Energiron cannot be retrofitted. For Midrex plants, a CO2 removal system could be retrofitted on the process top gas stream (where the higher concentration of CO2 allows for relatively low-cost capture), but this would only allow ~55% of CO2 to be captured. A capture system on the reformer stack would allow more complete capture, but the lower concentration of CO2 in the stack gas would require larger equipment, incurring additional costs.
Figure 32: CCS installation points for DRI
A few production pathways define the most likely methods of future steelmaking in the U.S.
BF-BOF: The blast furnace to basic oxygen furnace route, sometimes referred to as “integrated steelmaking”, has been the primary route for producing steel globally since the 1950s. It utilizes coke (heat processed coal) and sinter and/or pellets (processed iron ore) to produce a pure iron product in liquid form (hot metal) that is used in an oxygen furnace to make steel. The U.S. currently has 8 BF-BOF facilities (six of which are operational) that will look to develop decarbonization strategies through one of the following pathways.
BF-BOF with CCS: Integrated mills can utilize carbon capture and storage to reduce their carbon emissions by installing a system on one or more of the key emissions points outlined in Figure 31.
Submerged arc furnace (SAF) / Electric melt furnace (EMF): The SAF or EMF is a type of electrically powered melting furnace, like an EAF. In the context of steelmaking, these furnaces take solid iron from a DRI plant and melt it into liquid iron, which can be used in a BOF or EAF in a manner almost identical to the way that hot metal is used from a blast furnace. When installed in an integrated facility, the steel production process from the BOF to final product is unchanged, requiring no other changes to the mill’s equipment while maintaining the same product portfolio. SAF furnaces are also more capable of removing high levels of slag than an EAF, which allows the DRI plant to utilize lower quality, blast-furnace grade iron ore pellets. Because the process consumes DRI, steelmakers will have the choice to utilize hydrogen or natural gas in the ironmaking process, resulting in diverging pathways.
Modern installations can take hot DRI directly from the plant (at roughly 650°C) and charge it directly into the SAF or EMF, saving significant amounts of energy. SAF/EMF technology is very mature, having been used for many years in the production of steelmaking ferroalloys, but there are only a small number of installations in use for high-volume steelmaking. In the U.S., Steel Dynamics uses an SAF at its Iron Dynamics facility in Indiana to melt solid DRI and feed it into a standard EAF.
DRI-SAF-BOF with CCS: Carbon capture can be installed on the SAF pathway on a few different points. Both the DRI plant and the basic oxygen furnace can be equipped with carbon capture, providing varying levels of abatement depending on the melt chemistry and number of capture systems. For the analysis below, the capture system is installed on the DRI and BOF.
Traditional EAF: The EAF is responsible for around 70% of steel production in the U.S. The process has an inherently lower emissions level as it removes coal mining, coking, blast furnaces, and the basic oxygen furnace from the steelmaking process. Scrap-based EAFs can utilize up to 100% scrap, further reducing their scope 3 footprint. A majority of EAF emissions come from electricity consumption and the use and transport of OBM inputs. Thus, the decarbonization pathways for EAFs focus on scope 2 and 3 emissions.
Clean energy traditional EAF: The clean energy pathway for EAFs provides a route for decarbonization at a relatively lower cost compared to alternative methods of abatement. However, the source of renewable energy will have a significant influence on costs, as energy storage systems might be required for intermittent sources. By switching from fossil fuel-based electricity to clean energy, producers can almost eliminate scope 2 emissions.
DRI-EAF: OBMs will continue to play a key role in the EAF value chain. As of now, many EAFs globally utilize high-quality pig iron produced in blast furnaces that use coal, leading to relatively high scope 3 emissions. These emissions can be reduced by switching from coal-based pig iron to natural gas produced DRI, as is done in the U.S.
NG-DRI-EAF with CCS: For this pathway, carbon capture is installed on the DRI plant top gas stream which will abate between 55% and 60% of the CO2 emitted, thus lowering scope 3 emissions for the EAFs it supplies. Higher capture rates could be achieved by applying CCS to the reformer stack. Although there is some interest in developing CO2 capture from the EAF, its emissions (associated with carbon from the graphite electrodes and the iron) are comparably low, leading to relatively high abatement costs.25
H2-DRI-EAF: Traditional DRI production methods using natural gas, syngas, or other fossil fuel-based reductants promotes high carbon iron reduction. DRI producers can reduce their emissions by utilizing low-carbon hydrogen as a partial, or full reductant source. The transition to hydrogen DRI can be done gradually, allowing for delayed, or planned investment that does not sacrifice existing capacity. For instance, DRI or HBI produced to serve the EAF can be fed into blast furnace operations during the EAFs capacity ramp-up.
Hydrogen-based pathways offer significant abatement opportunity, with inherent flexibility, but the use of hydrogen at higher concentrations alters the chemical energy balance of ironmaking. Unless carbon-containing gasses are used in the initial reduction process, the resulting iron units will contain insufficient levels of carbon. Thus, additional carbon units must be injected into the melt when producing steel in the EAF or BOF. The injected carbon is less energy efficient, meaning that mills will require a higher volume of carbon units per ton of steel produced, increasing direct CO2 emissions.
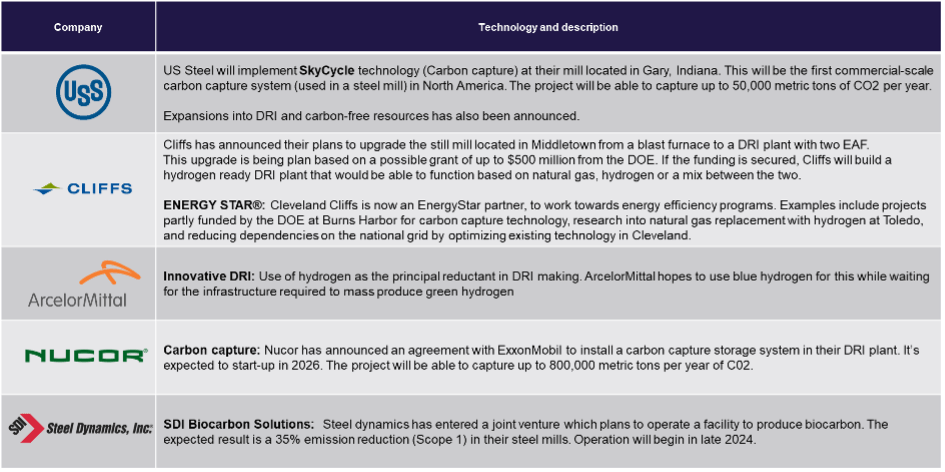
The large cluster of BF/BOF plants in northwest Indiana (Cleveland Cliffs Indiana Harbor, Burns Harbor, and U.S. Steel Gary) are in the best position to implement CCS, as they are close enough to utilize shared infrastructure, with significant storage capacity available within 150 miles in central Illinois. This geographic region contains significant amounts of other heavy industry, which could also make use of any CCS infrastructure. USS Mon Valley and Cleveland Cliffs Cleveland plant are both close to storage in eastern Ohio but are too far apart to share infrastructure; they could benefit from the implementation of either CCS or DRI. Table 3 below summarizes the decarbonization pathways currently being explored or implemented by domestic steel producers.
Table 3: Steelmaking decarbonization developments in the U.S.
Decarbonization pathway methodology and results
CRU developed the following methodology to identify and analyze feasible steelmaking pathways, ranging from status quo “baseline” production methods to highly advanced alternatives which have not yet been commercialized. The methodology deconstructs current and future steelmaking pathways into individual options that are grouped into process pathway categories including 1) iron ore source, 2) reductant, 3) ironmaking technology, 4) iron unit source, 5) steelmaking technology, and 6) carbon capture as shown in Table 4. The table includes the relative impacts to employment for adopting different pathways. Recent announcements have shown up to 6% increases in employment in replacing a blast furnace with a DRI and SAF.
The options within each pathway have been identified and check marked in the following table. For example, a BF-BOF pathway requires 1) BF pellet iron ore, 2) coal/coke as a reductant, 3) ironmaking via a blast furnace, 4) resulting in hot metal, which is 5) converted to steel in a basic oxygen furnace. A BF-BOF with CCS will follow the same pathway as a traditional BF-BOF but require additional capital and operating expenses to implement carbon capture technology. The NG-DRI-SAF pathway echoes the recent announcement by Cleveland Cliffs that they plan to transition from the traditional BF-BOF operation to a DRI with EMF at their Middleton facility. A traditional EAF starts with 1) scrap as the iron unit source which is 2) converted to steel using an EAF.
Table 4: Feasible steelmaking pathways

Comparison of pathway costs and abatement levels
The following section presents the CapEx, OpEx, CO2 abatement, CO2 intensity, abatement cost, and expected years to commercialization of each pathway presented in Table 4.
Table 5: Summary matrix of steelmaking configurations
| Key pathways | CapEx ($/t capacity)27 | OpEx ($/tcs) | CO2 intensity (t CO2/tcs)28 | CO2 abatement (t CO2/tcs)28 | CO2 abatement cost ($/t CO2)28,29 | Years to commerc-ialization |
|---|---|---|---|---|---|---|
| Traditional BF-BOF (Baseline) | 0 | 570 | 2.21 | – | – | 0 |
| Green H230 DRI SAF BOF | 900 | 841 | 0.22 | 1.99 | 175 | 6 |
| Blue H2 DRI SAF BOF | 900 | 708 | 0.77 | 1.44 | 149 | 5 |
| NG DRI SAF BOF CCS | 1,530 | 601 | 0.94 | 1.27 | 129 | 4 |
| BF-BOF with CCS | 420 | 647 | 1.14 | 1.07 | 115 | 4 |
| NG DRI SAF BOF | 900 | 589 | 1.27 | 0.94 | 104 | 0 |
| Clean-e Traditional EAF | 450 | 591 | 0.53 | 1.6831 | 36 | 0 |
| Traditional EAF | 450 | 571 | 0.77 | 1.44 | 40 | 0 |
| Green H2 DRI EAF | 1,000 | 748 | 0.17 | 2.04 | 130 | 6 |
| Blue H2 DRI EAF | 1,000 | 748 | 0.17 | 2.04 | 130 | 6 |
| NG DRI EAF CCS | 1,070 | 548 | 0.82 | 1.39 | 51 | 4 |
| NG DRI EAF | 1,000 | 537 | 1.04 | 1.17 | 45 | 0 |
Figure 33: Abatement pathways, x-axis: Abatement cost ($/t CO2), y-axis: Actual abatement (t CO2/tcs), bubble size represents years to commercialization (larger bubble equals earlier adoption)
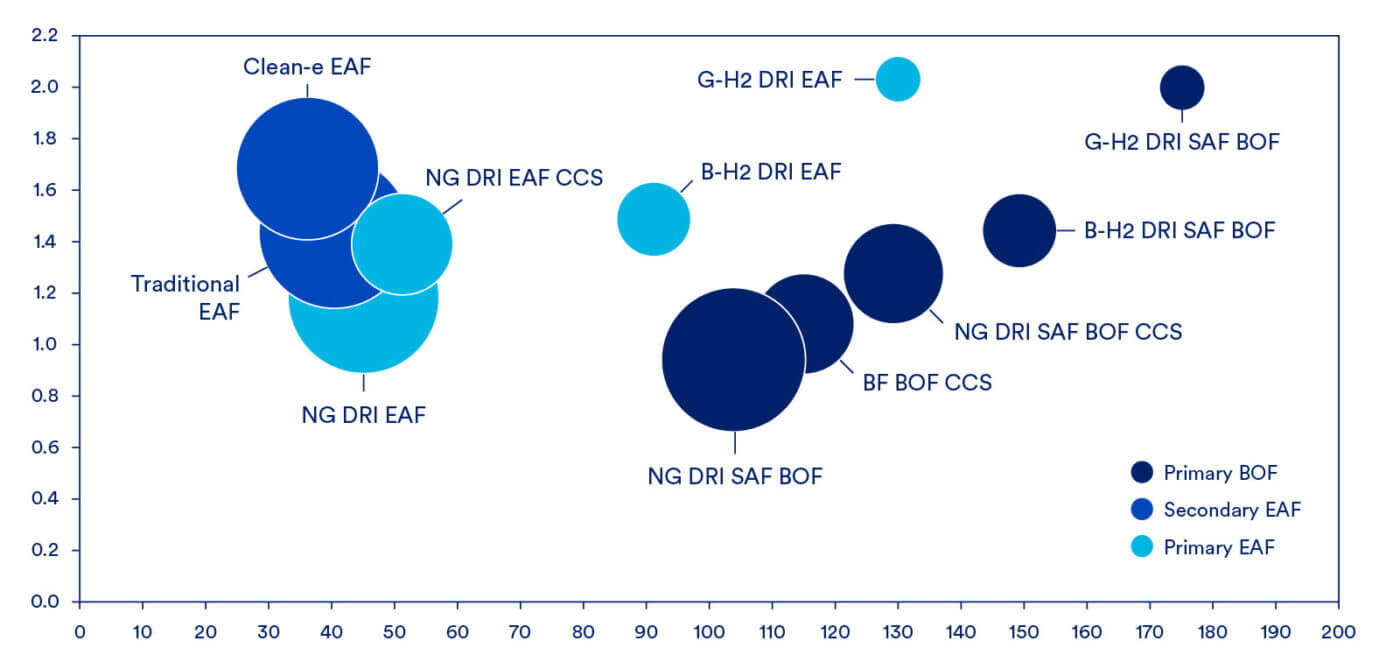
Note: Figure 33 shows abatement of scope 1 and 2 emissions in addition to scope 3 emissions, except for natural gas supply chain emissions. See next section.
Natural gas supply chain considerations32
Natural gas-based DRI production in the United States consumes significant quantities of natural gas, approximately 264 Nm3 per ton of DRI produced.33 While not included in CRU’s scope 3 figures throughout this report, the emissions contributions from the natural gas supply chain can and do have significant impacts to the scope 3 profile of DRI. The blue hydrogen DRI pathways are also impacted by these emissions. Production of hydrogen for these pathways consumes approximately 320 Nm3 of natural gas per ton of DRI produced.34 Finally, natural gas and coal are used to generate a large portion of electricity in the U.S., so there are emissions upstream of the power plant (for both fuels) that are attributable to power consumption for steelmaking using commodity grid electricity as opposed to low-carbon electricity. Generally, in the natural gas supply chain, the emissions contribution (CO2e) component from the methane emissions exceed those from the CO2 component, but the ratio of contribution will vary depending on source of natural gas; in any case reducing methane emissions (in addition to CO2 emissions) is an important climate mitigation goal and strategy.
To illustrate the importance of upstream natural gas emissions for hydrogen- and natural gas-based DRI, we used CATF’s methodology32 for calculating the contributions of both methane and CO2 emissions associated with the natural gas supply chain to perform a sensitivity analysis using three U.S. sources of natural gas representing high (Permian), national average, and low (Appalachian) supply chain emissions. The results presented in Figure 34 show each pathway’s total CO2e intensity, including the associated emissions from the natural gas supply chain, for various sources of natural gas.
Figure 34: Total CO2e emissions impacts (scope 1, 2, and 3) from NG-DRI & B-H2-DRI steelmaking pathways including natural gas supply chain emissions for U.S. Average, U.S. High (Permian), and U.S. Low (Appalachian) gas (tCO2e/tcs)
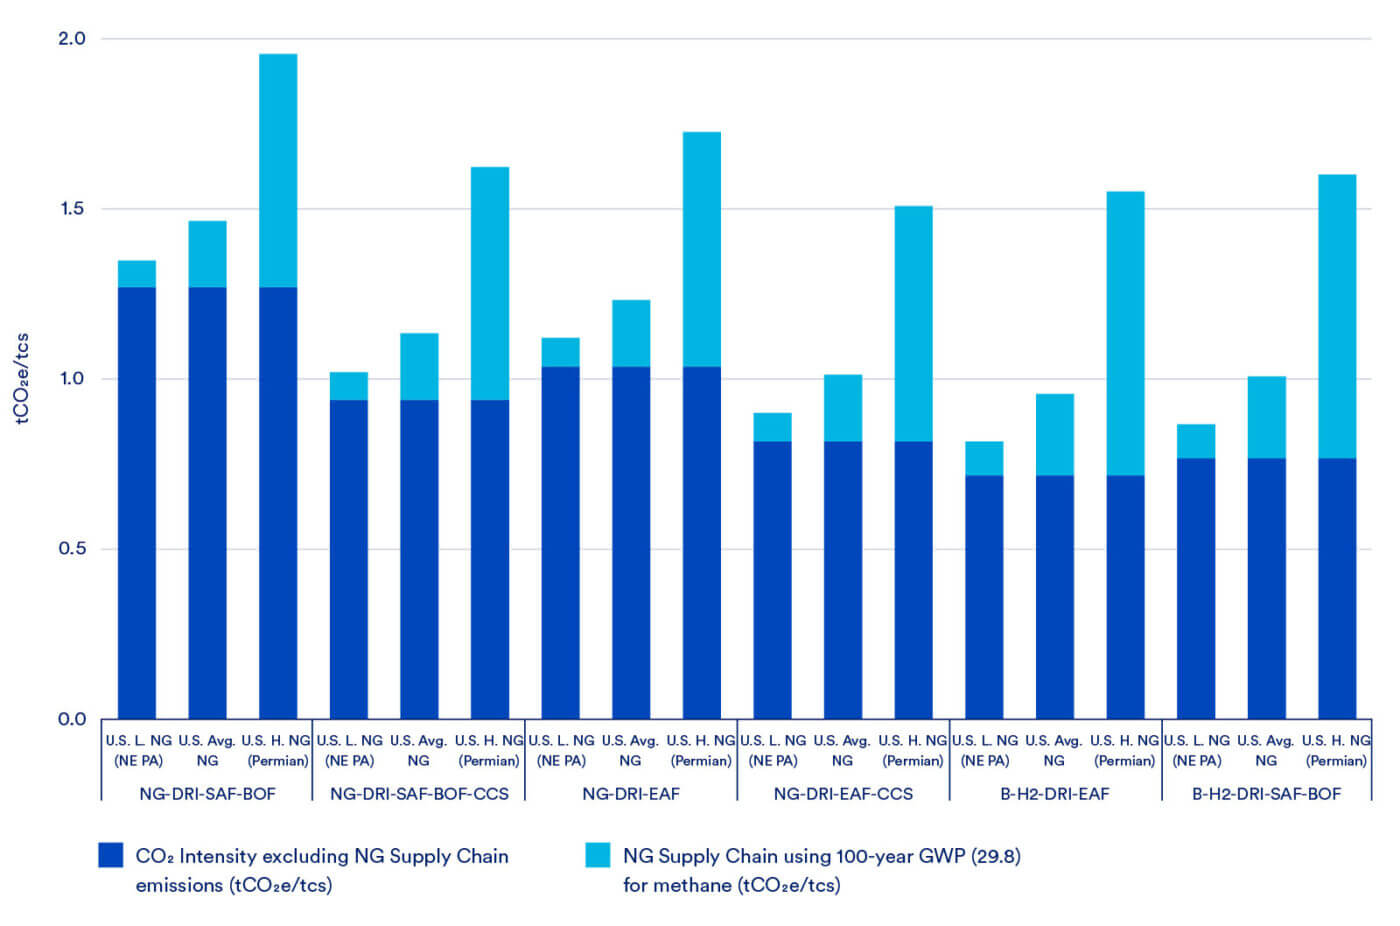
Note: Methodology based on https://www.catf.us/resource/analysis-lifecycle-greenhouse-gas-emissions-natural-gas-coal/
The overall emissions intensity of the NG-DRI pathways could increase by approximately 6% to 84% depending on the source of natural gas and production pathway. Even though both the NG-DRI-EAF and NG-DRI-EAF-CCS pathways consume similar amounts of natural gas per ton of DRI produced, the emissions from the natural gas supply chain make up a larger proportion of the overall emissions in CCS pathway due to lower direct emissions and therefore have a greater potential to impact the total emissions profile. Similarly, the overall emissions intensity of the Blue H2 DRI pathways could increase by approximately 13% to 116% depending on the source of natural gas used to produce hydrogen and the steel production pathway. Because of the higher natural gas usage in Blue H2 pathways when compared to the NG-DRI pathways, the supply chain impacts are also higher. Even in scenarios with the highest emissions from the natural gas supply chain, total emissions of any DRI pathway are still lower than an unabated BF-BOF plant. Reductions in the carbon intensity of the natural gas supply chain would significantly lower the total scope 3 emissions profile for DRI.
It is important to note that while these upstream emissions are quite significant, they are also quite variable and it is feasible to significantly reduce these emissions, for example with regulatory emissions standards covering natural gas facilities.
Key takeaways from decarbonization pathways
Domestic steelmakers have a variety of decarbonization pathways from which to choose. To select the most feasible decarbonization pathway, a variety of constraints need to be considered, such as product portfolio, level of decarbonization, energy supply, hydrogen availability, CCS locations and infrastructure. The following sections outline the key constraints of each pathway, and the tools steelmakers will use to reach partial or full decarbonization.
Integrated mills will take advantage of alternative iron production as the first step
Switching iron production from a blast furnace to a DRI-SAF facility utilizing natural gas is a currently available pathway for U.S. integrated mills. This will achieve partial decarbonization and will prepare for the future use of hydrogen at the DRI facility, while allowing the mill to operate the BOF and downstream facilities with no modifications. The BF-BOF with CCS pathway offers similar levels of abatement at a slightly higher cost, but it does not allow for the potential future conversion to green hydrogen that a DRI plant provides. For deep decarbonization, one likely path for integrated mills will be a green hydrogen fuelled DRI plant feeding into an SAF, which will then feed liquid iron into the BOF. Another option for this pathway is to utilize blue hydrogen as an intermediate step before making the full transition towards green hydrogen. The flexibility to drive deeper decarbonization levels via hydrogen without expending significant additional CapEx on the DRI plant is an advantage of the DRI production route. This specific transition is already planned for the Middleton facility owned by Cleveland-Cliffs, where they are building a DRI facility along with two SAFs to replace a blast furnace.
An EAF powered with clean electricity and using natural gas produced DRI will have a relatively small carbon footprint
The clean electricity scrap-based EAF has the lowest abatement cost on a $/t of CO2 basis. However, it will be difficult to match the quality of steel with that of integrated steelmakers without the use of large amounts of OBM. EAF producers that do not require low residual steel to service their customers can make a switch to clean electricity to reduce emissions, with no changes to process flow. Referencing back to Figure 15, this switch would reduce the overall emissions of EAF production by roughly 20%.
EAF producers that require higher product quality will require OBMs as an input. The most logical first step will be implementing a natural gas fuelled DRI facility, particularly if that DRI can be hot charged into the EAF, lowering the amount of electricity needed to melt the DRI. The NG DRI EAF will achieve higher abatement relative to the NG DRI SAF BOF pathway, at a significantly lower operating cost. Making the switch to NG DRI iron production along with a switch to clean electricity is a pathway that is available and in use today. To further decarbonize the production process, the operator will have the option to either install CCS on the DRI plant or switch to green hydrogen, both providing higher levels of abatement, with CCS being more cost effective.
Several key constraints will impact the speed and cost of adopting new steelmaking pathways
Plant age and configuration will challenge the viability of decarbonization pathways for U.S. integrated mills
The integrated steel mills in the U.S. have a long history of steelmaking. These facilities are relatively old, which limits the options for easily integrating carbon reduction technologies. Pathways are limited by plant design, zoning, location, and financial constraints. On a more positive note, most steel producers route their process off-gases through a variety of scrubbers and baghouses to minimize emissions and maintain compliance with environmental regulations, which provides potential collection points for CCS.
Plant age will dictate the time-cost effectiveness of installing carbon capture technology. As with all capital investments, there is a payback period for CCS equipment. If a mill is expected to reline or shut down, investments in facility upgrades are less likely. Recent scheduled facility relines in the U.S. have been delayed or postponed over public disapproval regarding continued mill emissions of pollutants such as benzene, hydrogen sulfide, and PM2.5 particulates. Because of this, future relines are likely to coincide with decarbonization technology announcements, to take advantage of the facility downtime and to answer stakeholder concerns.
Figure 35: U.S. blast furnace reline timeline
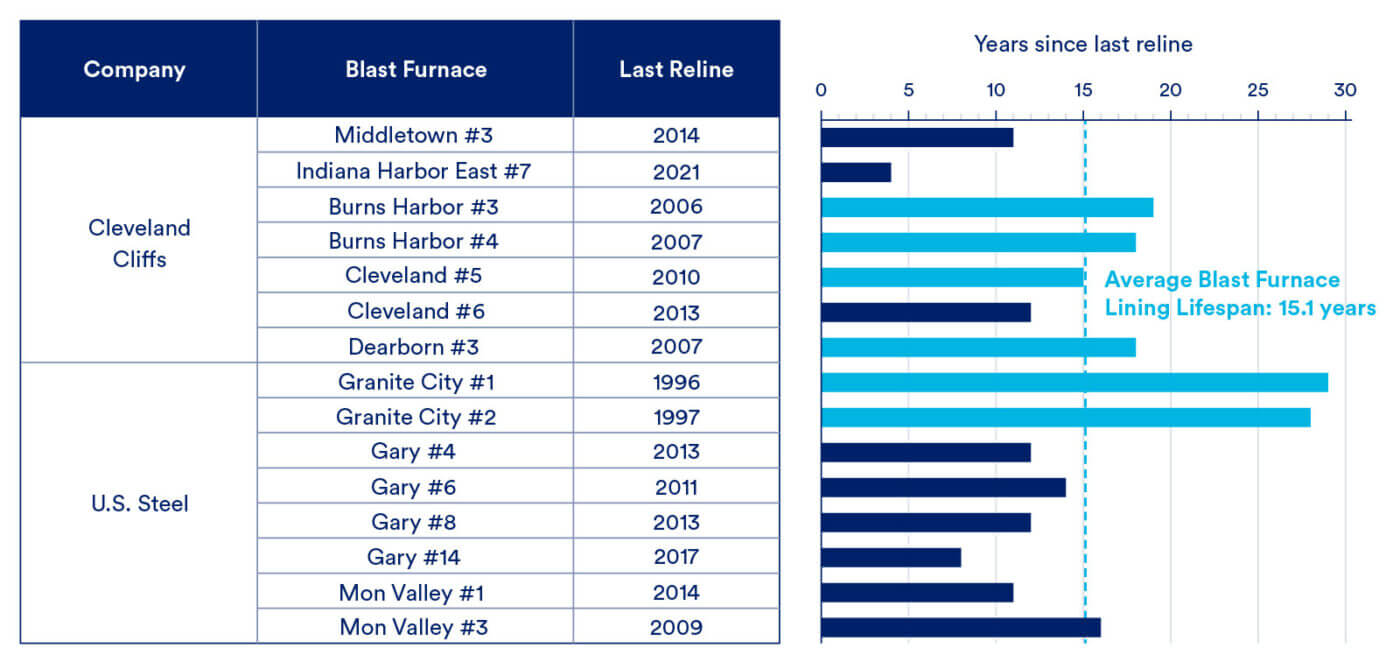
Note: Reline schedules provide a measure for when a furnace is likely to come offline in the future
While some integrated mills will take advantage of CCS to maintain the production status quo, plants like Cliffs Middletown see DRI/EMF as a more effective route. It remains to be seen how the Middletown conversion will advance the decarbonization effort for other U.S. mills. The DRI-SAF switch is a suitable abatement pathway for integrated mills, but the investment is very costly ($1.8 bn for 2.7 Mt of capacity). Cliffs will run the DRI plant with natural gas, with the option to switch to hydrogen or to equip the DRI plant with CCS. Given the much lower carbon footprint of a DRI plant (particularly if the SAF is powered with clean electricity), proper incentives35 will help to justify the additional $500 million needed for CCS to abate an already reduced carbon footprint. The 45Q tax credit for carbon sequestration, for example, provides a credit of $85 per ton of CO2 captured and permanently stored. This could lead to partial or potentially full coverage of CCS OpEx costs, especially for integrated mills.
CCS on an integrated mill cannot provide full abatement but can offer a more cost-effective route when compared to a full hydrogen-DRI SAF conversion. By utilizing CCS, integrated mills achieve short term abatement but accept financial risk in the event of a conversion or shutdown. Mills which have most recently relined or committed to extended production will be more likely to adopt partial abatement strategies like CCS. On the other hand, plants like Middletown are incentivized to make more permanent changes prior to an expensive reline.
EAFs consume DRI, often produced offsite, creating a separation in the value chain. DRI facilities and the EAFs they serve bear the cost of their respective carbon capture strategies individually. In this way, both facilities are constrained by the other’s willingness to pay or willingness to accept one another’s desired abatement strategy. DRI plants which chose to produce decarbonized material, either by utilizing hydrogen or installing CCS will be subject to the associated higher costs and, if possible, will cover those increased costs via higher charges for the material sold, increasing the raw material cost for associated EAFs. DRI plants producing low-carbon DRI will depend on the market’s willingness to pay premium prices for reductions in carbon intensity that are marginal relative to the EAF’s overall emissions. Ultimately, facilities that choose to abate through a lower carbon supply chain will view clean DRI as a useful option, and may invest in their suppliers, but for those who focus their efforts on decarbonizing energy use, they may settle for the less costly, more carbon-intensive DRI that is currently available.
To reduce their carbon footprint as well as to take advantage of a market for low-carbon OBMs, some DRI producers are positioning themselves to provide low-carbon OBM. Nucor Louisiana is equipped with carbon removal technology and is capable of a 100% conversion to hydrogen reduction through its Energiron system. Plants with an existing recycling system like Energiron would only need to install a compressor and some auxiliary equipment to reach 60% abatement, greatly reducing the cost compared to a full CCS system on a standard NG-DRI plant. However, the other two DRI plants in the U.S. use a different technology (Midrex) and would require additional equipment to implement carbon capture.
The efficiency and cost of CCS depends on the location of the plant, CO2 transport, and storage process. CCS uses large, integrated systems to reroute, process, treat, and capture off-gasses from industrial processing. Although the process can reduce steelmaking emissions, there will be constraints implementing the technology given the state of their equipment, plant location, and budget. As demand for decarbonization grows, CCS can be used to reduce emissions for high-polluting industries like power generation and steel and will be an option for remaining BF-BOFs in the U.S. It may also find use in DRI plants and some EAF production where the plant’s configuration is conducive to cheaper CCS integration. CCS investments are picking up pace in Europe and the Middle East. As more projects prove technological and economic viability, this trend will grow. CRU expects clusters of CCS developments to form around prime storage locations. This will be driven by the cost relationship between a plant’s distance to storage, and the cost of transporting the captured gas. Pipelines will cost millions to install, and every additional mile that is constructed could add between $1-$3 million in CapEx, depending on pipeline diameter and building terrain.36,37,38 This range considers variable pipeline diameters that could be used for CO2 transport, but these figures are not representative of detailed modelling conducted by CRU. Clustering infrastructure and investing in CO2 pipeline corridors will provide economies of scale and synergies to reduce investment risk and the unit cost of storage.
Different types of geological reservoirs such as saline formations and oil and gas reservoirs can be used for CO2 storage. Current CCS storage resources are estimated between 3,000 and 8,600 Gt CO2 in the U.S. By comparison, the U.S. emits 5 Gt CO2 per year. While there is plenty of underground storage capacity, scaling capture projects also requires the timely permitting, construction, and operation of CO2 transportation infrastructure and issuance of Class VI well permits. Due to its concentration of heavy industry, existing infrastructure, and the availability of relatively close geological storage, the Great Lakes area is one of the most favorable regions for CCS applications. This advantage would come from currently operating CCS facilities and pipelines serving power and cement producers in and around the Great Lakes region.
The map below highlights the availability of modeled CO2 storage potential in relation to the location of U.S. steel facilities. The reader should note that a gap in modeled storage potential exists near the high concentration of EAFs in the Southeast, which may require additional transportation infrastructure to reach available storage.
Figure 36: Availability of modeled CO2 storage potential in relation to the location of U.S. steel facilities
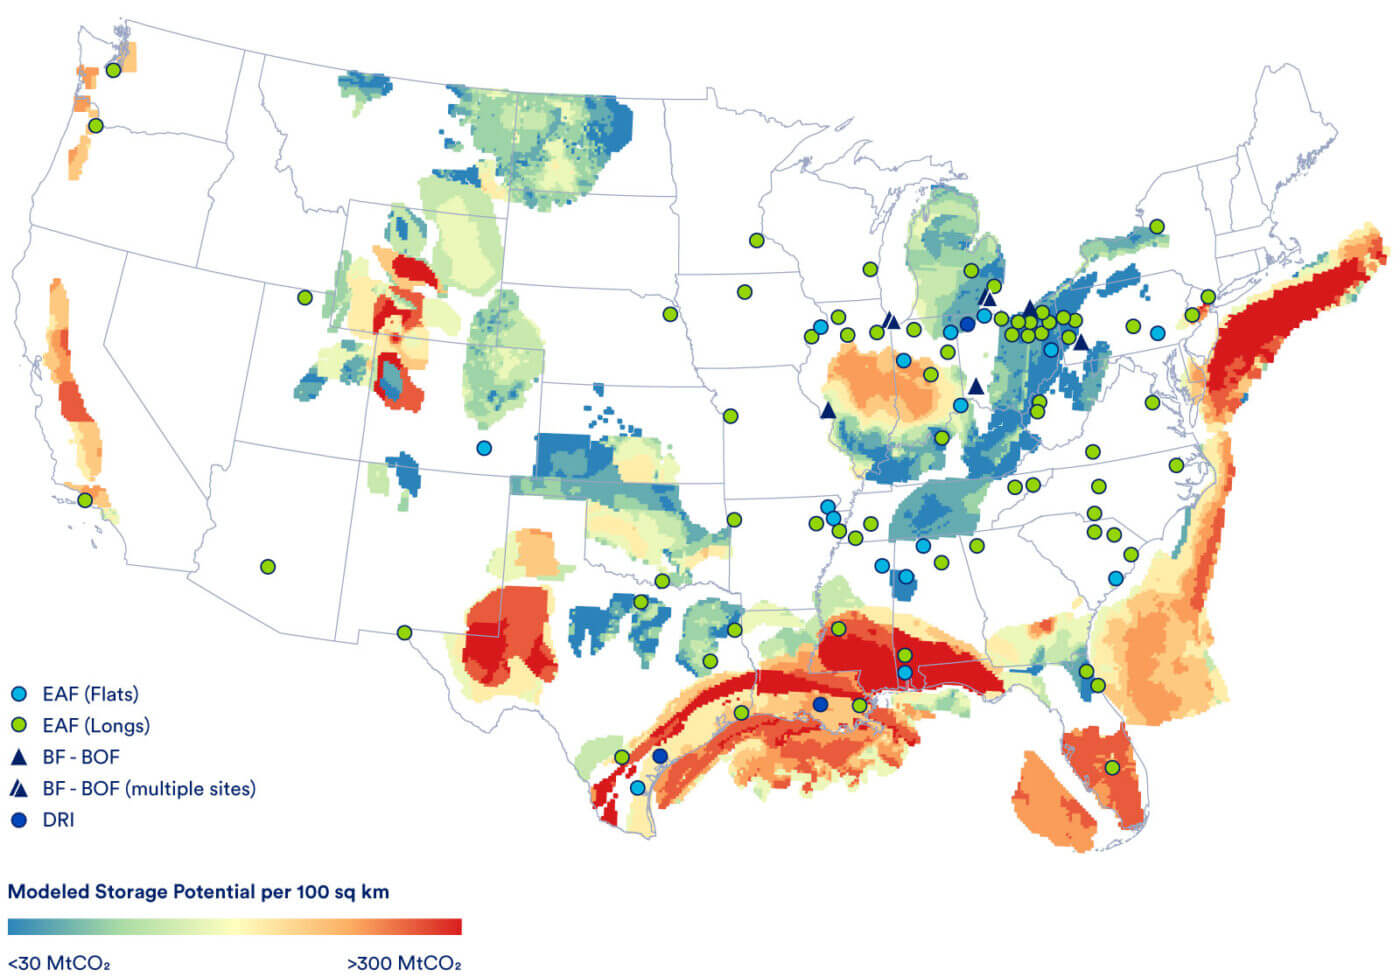
Assuming a facility installing CCS is favorably located and can justify the transport and storage costs, the operator must also consider the state and configuration of their plant. The cost of the capture and processing equipment for CCS depends on the number of capture points within a facility. The age and design of many U.S. integrated mills is not necessarily conducive to expansion and may lead to complications in the installation process, although the fact that many mills route much of their process off-gas to a power plant is helpful in that it provides a single point for CCS. Furthermore, the increased power consumption will increase operating costs as mills will need to import power to supplement the new demand.
Decarbonized steelmaking will continue to demand high-quality iron units
Demand for iron ore will decline, both globally and in the United States as scrap availability improves and steelmaking shifts to scrap-based EAF production. However, as EAF production continues to increase, OBMs will be increasingly needed to provide high quality metallics to maintain the requisite steel chemistry. It is likely that some blast furnaces will remain, but the primary source of OBMs is expected to gradually switch to DRI. Along with producing high quality, low residual metallics, DRI plants provide a level of flexibility not available to blast furnaces, which are difficult and expensive to idle. Modern DRI plants use natural gas as the reductant, which is inherently lower in CO2 emissions than a coke-fed blast furnace and can use various forms of hydrogen to further reduce emissions. DRI also eliminates the need for coal and coke making, which itself is a high-emissions process.
Global demand for high-grade iron ore exceeds the current supply (for both DRI and BF usage), but recent investments in DR pellet conversions and DRI plants demonstrate producers’ interest in this switch. The chart below highlights the expanding DR pellet supply in North America at the expense of declining sinter fines and BF grade pellet supplies.
Figure 37: North America supply of iron ore, 2023-2050, %
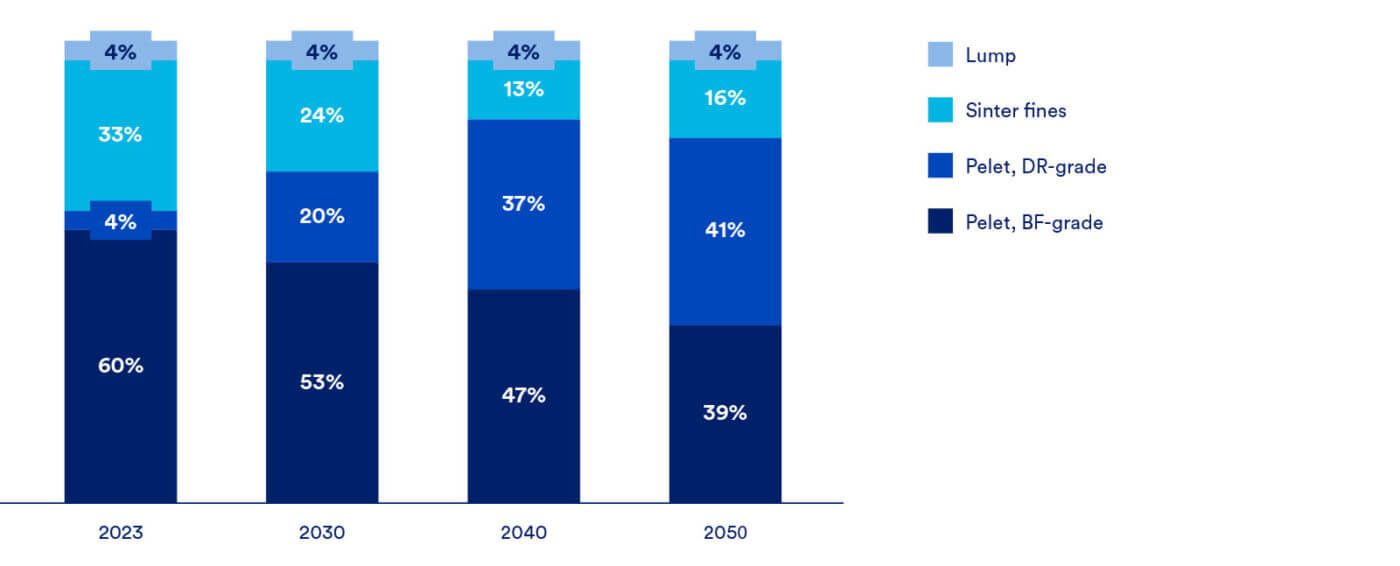
The availability of quality scrap and metallics continues to be a limiting factor in the growth of scrap-based EAF facilities
The growing number of scrap-based EAFs requires a highly developed scrap supply network, more common in developed economies. Scrap supply is a function of historical steel production in the U.S., with scrap availability increasing over time as cars, buildings, and consumer goods are recycled at the end of their useful life. EAFs are strategically located around regional economies with an established supply of scrap. The Southeast continues to emerge as a center for EAF production, exhausting its regional scrap supply and pulling more from the Midwest and Northeast. Although the availability of scrap continues to grow, it is important to note that this applies more to end of life,39 low-quality scrap. EAFs producing high-quality products must limit residuals charged into the furnace, increasing the importance of sourcing clean, or prime, scrap. Because of the limited supply of prime40 scrap in the U.S., there remains a gap to meet the total metallics demand for crude steel production, which will continue to be filled by blast furnace hot metal or DRI. Recycling efficiency and sorting technologies will need to evolve to allow steel makers to increase their scrap utilization and further lower their emissions footprint.
Figure 38: U.S. net scrap generation and demand, Mt
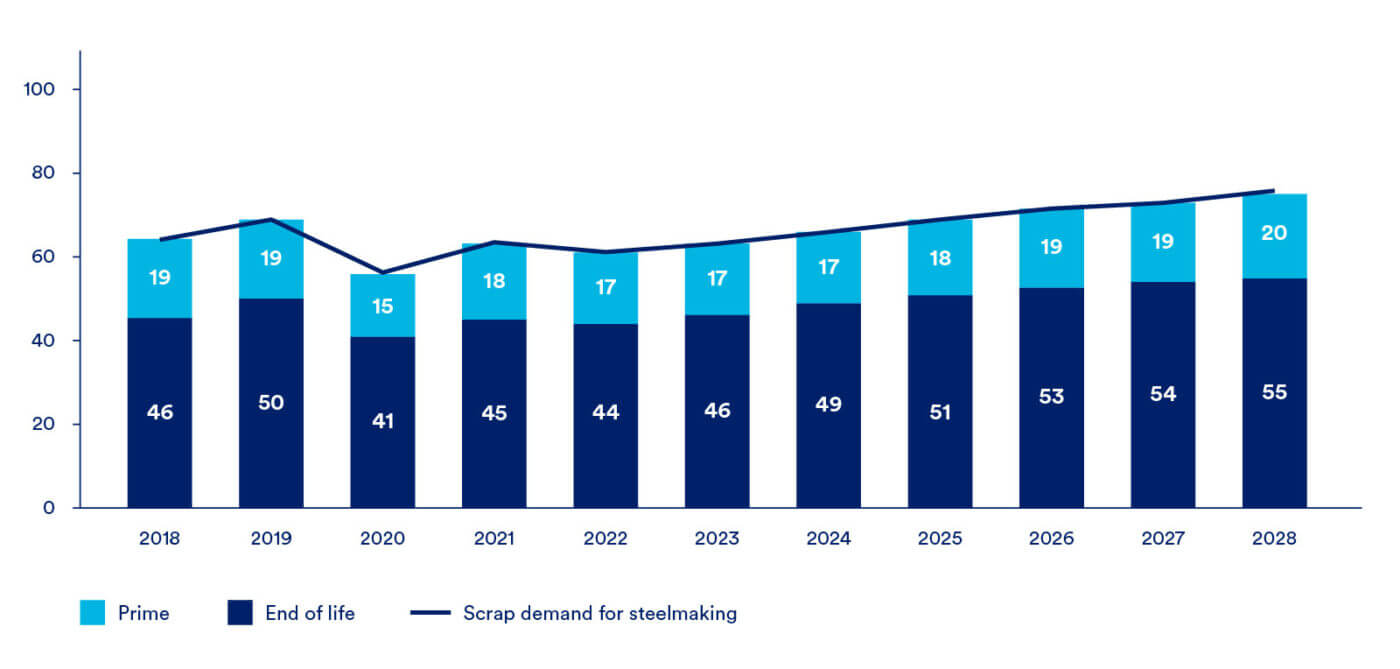
Although domestic producers have recently (since 2020) added new DRI and (cold) pig iron capacity, the continued increase in EAFs and idling of blast furnaces means that high-quality metallics remain in short supply. Domestic steelmakers consume roughly 30 million Mt of OBMs a year, a number expected to remain unchanged going forward due to a lack of domestically generated prime scrap. This supply gap has (not unexpectedly) been filled by imports, with the U.S. importing 1.4 Mt of DRI/HBI and 4.2 Mt of pig iron in 2023. As most of these materials were created via standard production pathways, they carry a high carbon burden, which falls directly into steelmakers’ scope 3 emissions. For the domestic steel industry to fully decarbonize, a low-carbon replacement for these metallics is needed.
Figure 39: LHS: Pig iron and DRI demand (Mt), RHS: OBM import share (%)
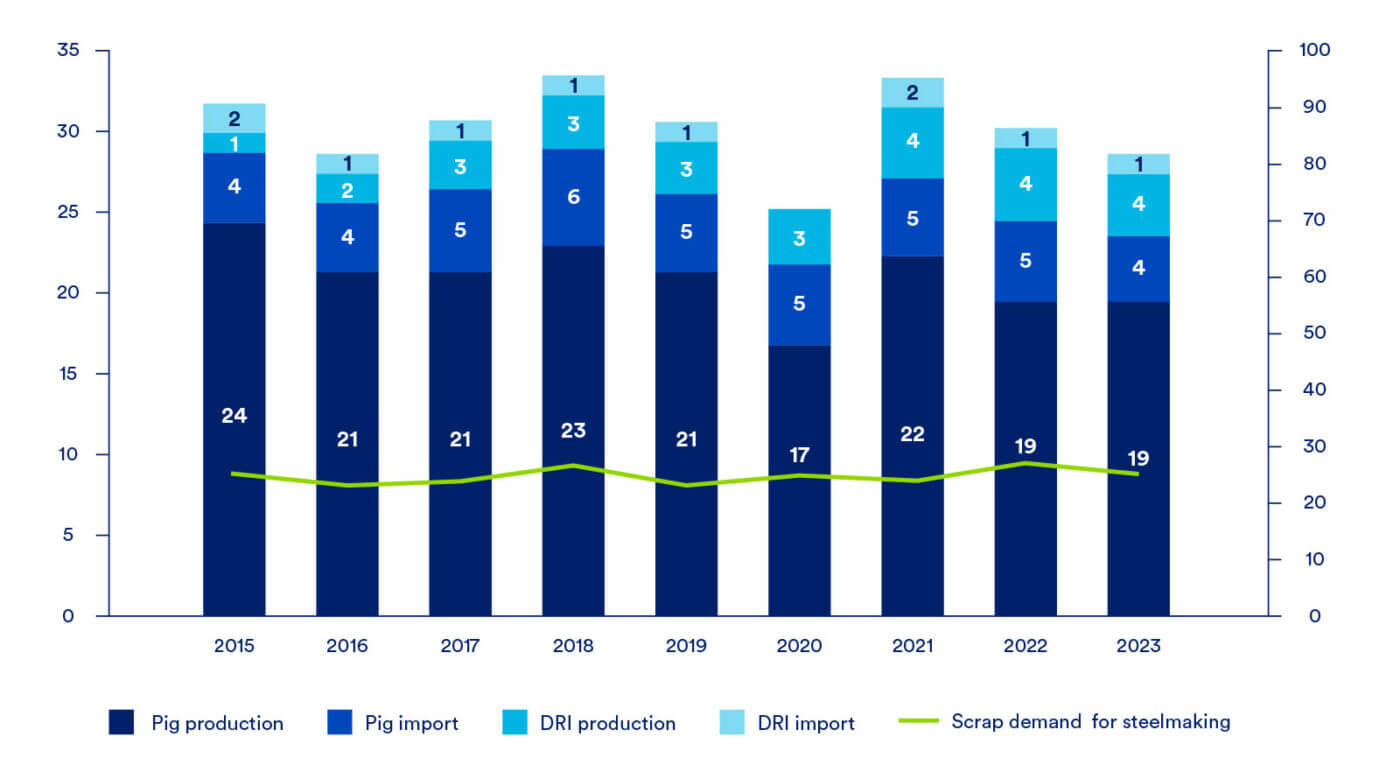
Significant cost improvements are required to make hydrogen economically and technically viable in the steelmaking process
Figure 40: Hydrogen overview

Hydrogen is an alternative feedstock for the direct reduction of iron, but supply, and high costs are major constraints. Significant infrastructure is required to deliver the large quantities of hydrogen that will be needed by steelmakers, as well as other industries that may use hydrogen in their production processes. The U.S. is incentivizing clean hydrogen production via multiple pathways with the federal 45V tax credit and has awarded seven Regional Clean Hydrogen Hubs which are expected to demonstrate regionally connected infrastructure,41 but this will be slow to unfold. In addition, the Department of Energy has also awarded up to $1 billion for a “hydrogen demand-side initiative.”
Steelmakers in the U.S. have a large supply of inexpensive, easily accessible natural gas as an alternative to hydrogen. This results in low emissions profiles compared to global counterparts, resulting in less pressure to switch to alternative fuel sources that pose additional operational challenges. H2 Green Steel is a DRI plant under construction in Sweden that will use nearly 100% green H2, aiming to begin production by 2026 and scale to 5 Mt/year by 2030.42 Currently, there are no DRI facilities in the U.S. able to produce iron with 100% hydrogen without modifications. In addition to the lack of hydrogen capable facilities, the reductant is not commercially available at the required scale, and no commitments to produce green hydrogen DRI over the next 10 years have been announced.
Figure 41: Reductant fuel costs for various direct reduction pathways, $/t Fe
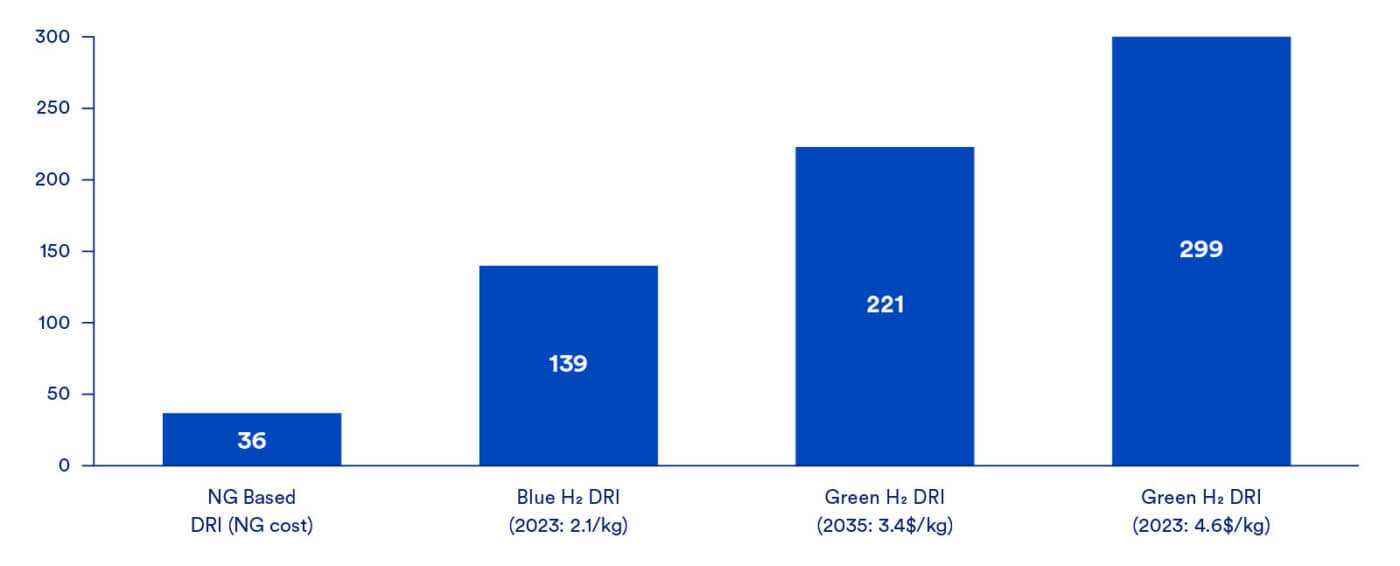
Figure 41 shows the difference in reductant fuel costs for producing a tonne of iron for each various direct reduction technologies. For a natural gas DRI plant, reductant costs increase by more than 8x when switching to green hydrogen. Steel manufacturing operates on tight margins, making it difficult for operators to switch to a more costly reductant fuel without financial or environmental incentives.
The cost of hydrogen ranges from 1.2 $/kg for “grey” to 4.6 $/kg for “green.” The technology to produce hydrogen is expected to improve over time along with declining clean electricity prices, with CRU forecasting green hydrogen prices falling to 3.4 $/kg by 2035 (real 2023). Electricity cost is the main cost driver for green hydrogen. Green hydrogen will require grid improvements to ensure large quantities of clean firm electricity are available for the hydrogen production. The switch to any form of hydrogen will require a reduction in cost and/or the introduction of market-based incentives.
To meet the ~30 Mt of OBM required by U.S. steel producers via green production routes, significant buildout of green hydrogen must occur. Depending on system configurations the theoretical amount of hydrogen to produce 30 Mt of DRI Is ~1,950 kgH2. Total power demand from hydrogen production and the DRI plant is ~105 TWh.
Steelmakers are unlikely to use hydrogen-based DRI over natural gas DRI in the absence of additional incentives or regulatory drivers. As shown in Table 5 switching from a NG DRI EAF to a blue H2 DRI EAF will reduce emissions by 0.32 t CO2/tcs, but with an increase of over $83/tcs in operational expenses.
While the 45V tax credit aims to incentivize the production of clean (low-carbon) hydrogen, the 45Q tax credit incentivizes the capture and storage of CO2 and can also be used to lower the cost of fossil-based hydrogen production. The 45V credit ranges from $0.60/kg to $3.00/kg of hydrogen produced, depending on lifecycle emissions of that hydrogen assuming and that the production meets workforce requirements. 45Q does not have any carbon intensity requirements and would generate in the range $0.45/kg to $0.77/kg of blue hydrogen, depending on the type of storage (enhanced oil recovery or permanent storage) and carbon intensity of the process. A single project cannot claim both 45V and 45Q. It should be noted that the credit goes to the hydrogen producer, so that if a steel producer were to purchase hydrogen from an outside suppler, it would be the supplier that would receive the credit.
Currently, many existing (CCS retrofit) and announced hydrogen production projects in the United States may not be economical with 45V under the final 45V guidance, which does not incorporate upstream methane emissions43 on a producer-specific basis, but rather uses a national average. Adjusting the lifecycle analysis to better reflect specific hydrogen production facilities would be a more effective incentive to supply the steel industry with low-carbon/low-methane hydrogen.
Clean electricity is a crucial and quick win for decarbonizing the steel industry
The availability of solar, wind, nuclear, and hydro power is expected to grow in the next 10-15 years. In 2023, these sources made up 40% of electricity generated in the United States. CRU estimates clean electricity will make up 75% of annual production as early as 2035. The long-term forecast for renewable energy capacity is growing and will exceed fossil-fuel generated energy within the next decade, as shown in the figure below. Most of the steelmaking pathways in this study are energy intensive and will result in increased electricity demand. The steel industry will compete with other industries for the use of additional clean electricity capacity.
Figure 42: U.S. electricity generation by source, TWh
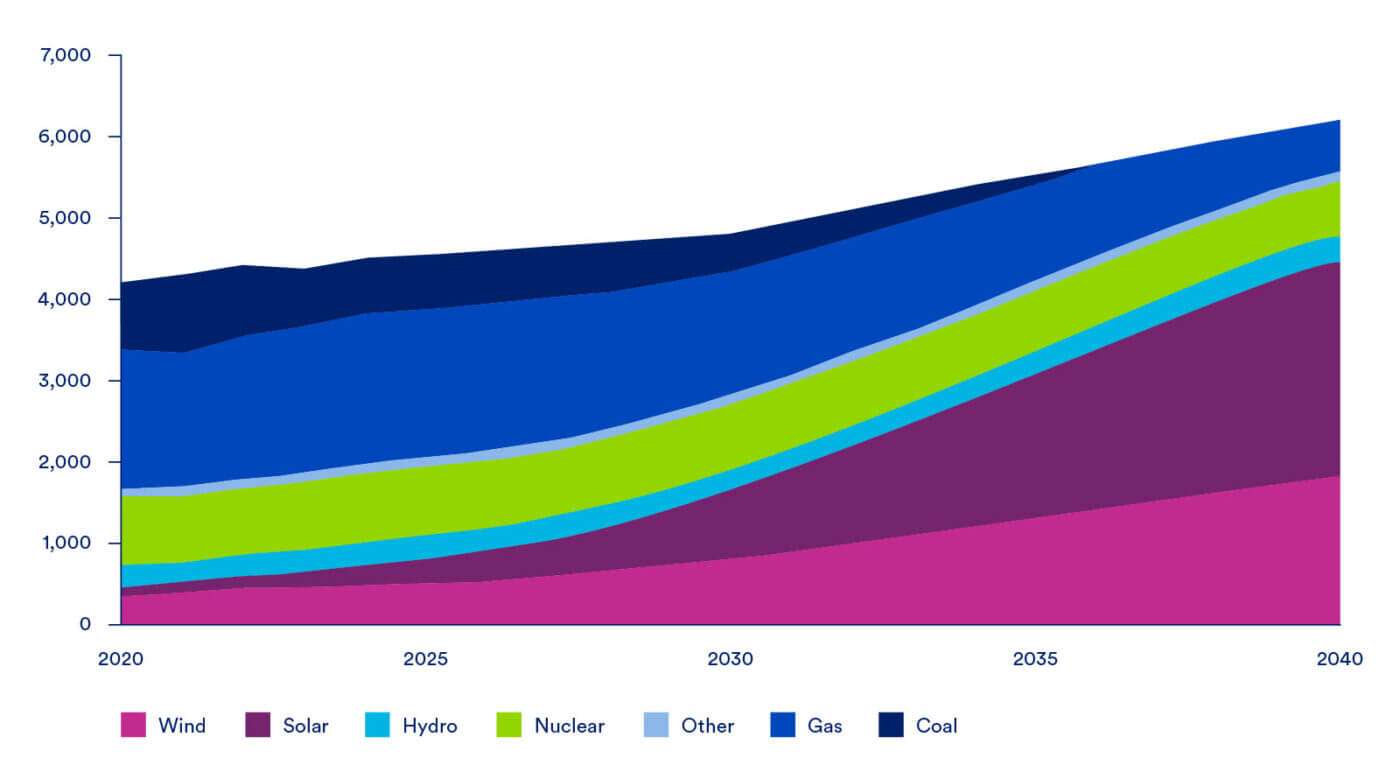
The cost difference between clean and non-clean electricity will be a constraint for steelmakers making the switch to clean electricity. On a levelized cost of electricity (LCOE) basis, the cost of renewable electricity is expected to continue declining over time relative to the cost of fossil fuel-based electricity. When factoring in the potential for future carbon taxes, the gap between renewables and fossil-fuels will continue to decline. The fossil-fuel industry is relatively mature and as a result there are less technological improvements to be made that will lower future prices. This report does not factor in any carbon costs, but if they occur in the future, it will increase the price of natural gas or coal. On the other hand, technology related to renewable energy has room to improve. The forecasted improvement in solar PV efficiency is reflected in the rising capacity and the stable price forecast. The figure below shows the associated costs to produce electricity for various energy sources.
Figure 43: U.S. LCOE by source, Real 2022 $/ MWh
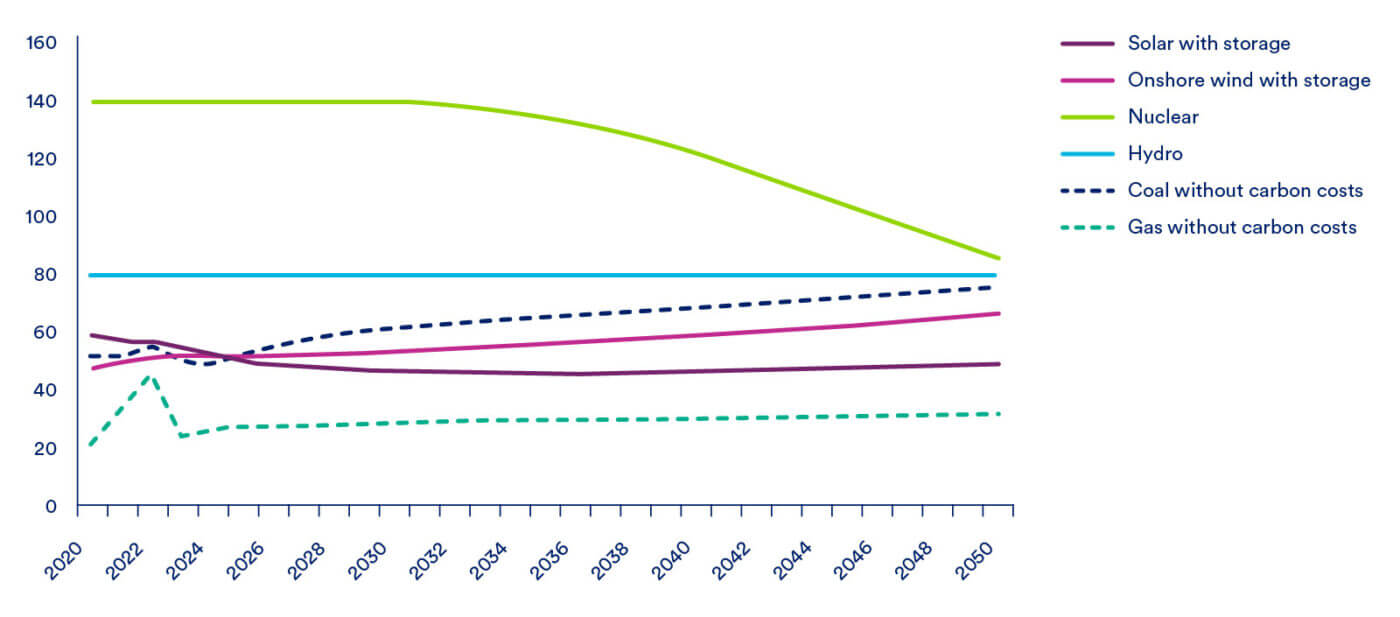
Note: Solar and wind include CRU estimate of energy storage costs.
A constraint for 100% renewable energy is weather dependence and variability in electricity generation. Unlike coal and gas, solar and wind energy can only be harnessed when the sources are active. Although output from each source can be forecasted, it is a significant hurdle for steel production. Power storage provides a solution to this problem, allowing the uninterrupted dispatch of electricity even when wind or solar generation is low. Forecasted prices of solar and onshore wind energy with storage capability is still lower than coal on an LCOE basis. However, the availability and cost of storage sufficient to run a steel mill remains uncertain.
Transmission of renewable electricity from dispersed generating sites also needs to be considered. It is difficult to predict the cost of the necessary grid improvements, but the cost of transmission line upgrades has the potential to double the renewable energy costs. For this reason, the above figure cannot be used in isolation to draw conclusions from the forecasted prices of renewable energy.
Electricity is a substantial constraint for steelmakers, since some proposed pathways require large amounts of electricity – for example, DRI utilizes ~135 kWh/t and the EAF around ~430 kWh/t. Electricity demand to produce 1 Mt of steel via the DRI-EAF pathway would require energy from 50-75 of the largest onshore wind turbines. To minimize costs and guarantee availability steelmakers have begun installing their own renewable energy supplies. Hybar’s 0.57 Mt EAF rebar mill in Arkansas (presently under construction) will receive up to 100% of its power from its own solar electricity facility, while Evraz has built a 300 MW solar field adjacent to its 1.0 Mt EAF mill in Colorado. These operations show it is possible to leverage clean electricity, but costs will increase as demand from the industry and others strengthens. However, shifting to green hydrogen-based steelmaking pathways requires significantly higher clean electricity demand of at least 3.5 MWh/t steel.
The potential for consumers to drive low-emissions steelmaking is limited and will require government led initiatives
As a long-established, capital-intensive process, there will need to be an incentive for producers to change their production methods. For decarbonized steel, one driver may come from consumers that prefer a lower carbon product. The automotive market has stood out as one of the few industries willing to pay a premium for decarbonized steel. As the first car maker to join the SteelZero initiative, Volvo has pledged to source 50% of its steel as low-embodied carbon or ResponsibleSteel certified, and 100% ‘near-zero’ steel by 2050. To capitalize on these markets several steelmakers have introduced “green” steel products, produced via a variety of low-carbon pathways, with the goal of obtaining a price premium. In the U.S., Nucor’s Econiq™ and U.S. Steel’s verdeX® are two examples of low-carbon, EAF-produced steel products, made in EAF facilities and paired (in some instances) with purchased carbon credits. Most of the demand for these products has come from auto manufacturers, particularly those from Europe.
Cars and appliances, where the consumers have a high level of interaction with the product, will be the markets where the final consumer will drive demand for decarbonized steel. However, even in these consumer-focused markets, the willingness to pay a premium for low emissions steel has been limited. Government imposed requirements on embedded carbon throughout all industries could also help drive producers in the end-use markets to demand lower-carbon steel products. In the long-run, consumers will not carry enough weight to influence steelmaking operations outside of a few niche sectors, and policy changes will be required to develop the broader market for decarbonized steel.
Policy support will be required for U.S. steelmakers to adopt decarbonizing steelmaking technologies
The technologies necessary to provide ‘deep’ decarbonization to the steelmaking process are or soon will be available. The primary constraint is the high cost, both CapEx and OpEx, of implementing these technologies. Steel is, with few exceptions, a fungible commodity, thus price is the key component in sales to downstream consumers. As decarbonization will inevitably add to the cost of steel, some sort of policy support will be necessary to drive consumption of higher-cost decarbonized steel.
Policy decisions regarding decarbonization are inherently global, and are intertwined with issues affecting manufacturing, reshoring, and supply chain security
For decarbonization to provide actual environmental benefit, emissions must be reduced on a global basis. If emissions are lowered in one region by exporting carbon production to another (less regulated) region, there is no net benefit. Global regulations are far from uniform, as seen in Figure 44 below. The U.S. withdrew from the Paris Accord for a second time on January, 20, 2025 under the President Trump, despite previous pledges made by the Biden administration to reduce emissions by 52% by 2030 compared to 2005-levels, in order to reach net zero by 2050. A quarter of the U.S. states have joined an alliance that is working to reduce power plant emissions,44 but there is no plan to expand this initiative to other carbon-emitting sectors, nor is there any federal plan in place to cap or tax carbon emissions. Rather, the U.S. opted to incentivize decarbonization via subsidies and tax credits through the Inflation Reduction Act (IRA). This is due to deep political divisions in the U.S., which have prevented any action on a national carbon tax. The view of CRU is that subsidies will not be viable over the long term and that the U.S. will need to implement a federal-level carbon tax (and accompanying CBAM) to drive decarbonization in the economy.45
Figure 44: International emergence of carbon pricing
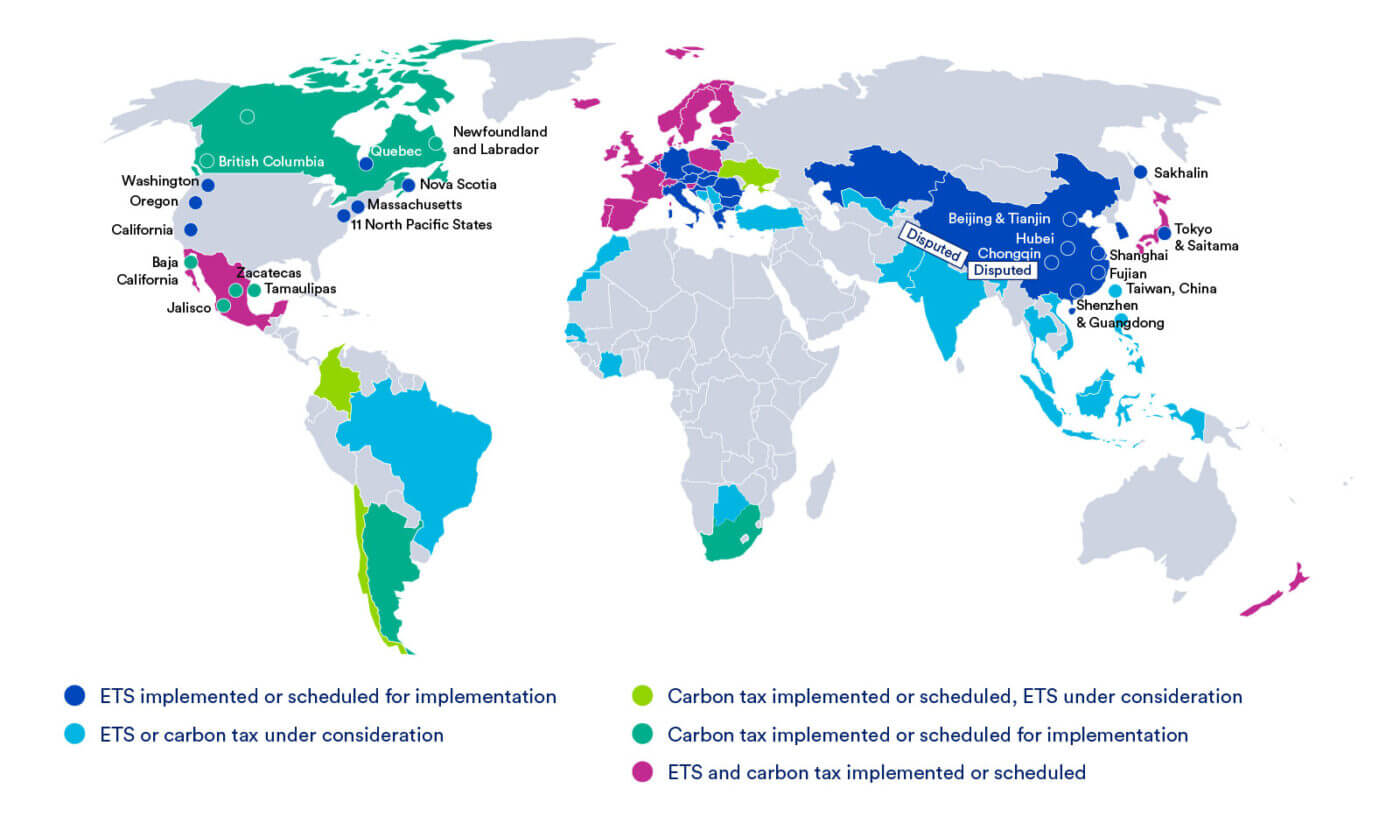
The use of carbon taxes or subsidies/tax credits inevitably leads to trade challenges. A government that imposes taxes on carbon emissions risks harming its carbon-intensive industries if they remain exposed to imports of commodities (such as steel) that are produced in regions that are not subject to carbon taxes. This issue can be solved via the use of tariffs: either a direct, flat tariff on imported material or a tax on the imported carbon, such as the European Union’s Carbon Border Adjustment Mechanism (CBAM). The implementation of CBAM will allow EU-based steel producers to compete on an even footing with imports by subjecting those imports to a carbon tariff roughly equivalent to the one being imposed internally via the EU Emissions Trading System, but only once free allowances have been eliminated in 2034.
The impact of CBAM and similar tariffs as applied to steel exports is minimal to the U.S. market, as little domestically produced steel leaves the USMCA region. Indeed, domestic steelmakers could conceivably benefit from CBAM-like mechanisms, as U.S. steel production is already some of the least carbon intensive globally. This could put domestic producers in the position of being able to export steel to countries operating CBAM-type mechanisms.46
As has been shown, one well developed and inexpensive way to decarbonize is to utilize scrap-based EAFs for steel production, and EAF production globally is expanding to take advantage of this. The U.S. is a net exporter of obsolete steel scrap (although the U.S. imports a much smaller amount of high-grade scrap); the use of this scrap allows other countries to utilize relatively low-carbon EAFs for steel production, helping to lower the global steelmaking emissions footprint. Were the U.S. to idle (relatively low emission) domestic blast furnace capacity and expand EAF production, utilizing more domestic scrap, global importers of this material would need to find a substitute supply of metallics. In the short term, this scrap will be replaced by primary iron production via the BF/BOF or DRI routes, both of which are significantly higher carbon emitters than domestic BFs, causing an overall net increase in global emissions. Thus, global decarbonization efforts would best be supported by not placing restriction on the export of scrap. Another consideration is the effect of re-shoring manufacturing on decarbonization and supply chain risk. As the U.S. is the leader in low carbon steel production, global decarbonization would best be served by maintaining as much steel production as possible in the U.S. However, the U.S. remains the largest importer of steel globally, for finished steel, semifinished, and for OBMs such as pig iron and DRI.
These imports are harmful from a decarbonization standpoint and represent a supply chain risk as well. This supply chain risk extends not only to finished steel, but raw materials and OBM, as EAF production is dependent on the availability of this material.
As an example, prior to 2022 Russia and Ukraine were the world’s largest exporters of pig iron, much of which was purchased for melting in EAFs. The outbreak of war in 2022 led to a global supply crunch and skyrocketing prices for this critical feedstock (Figure 45).
Figure 45: Pig iron spot price, USA CFR – USD/t
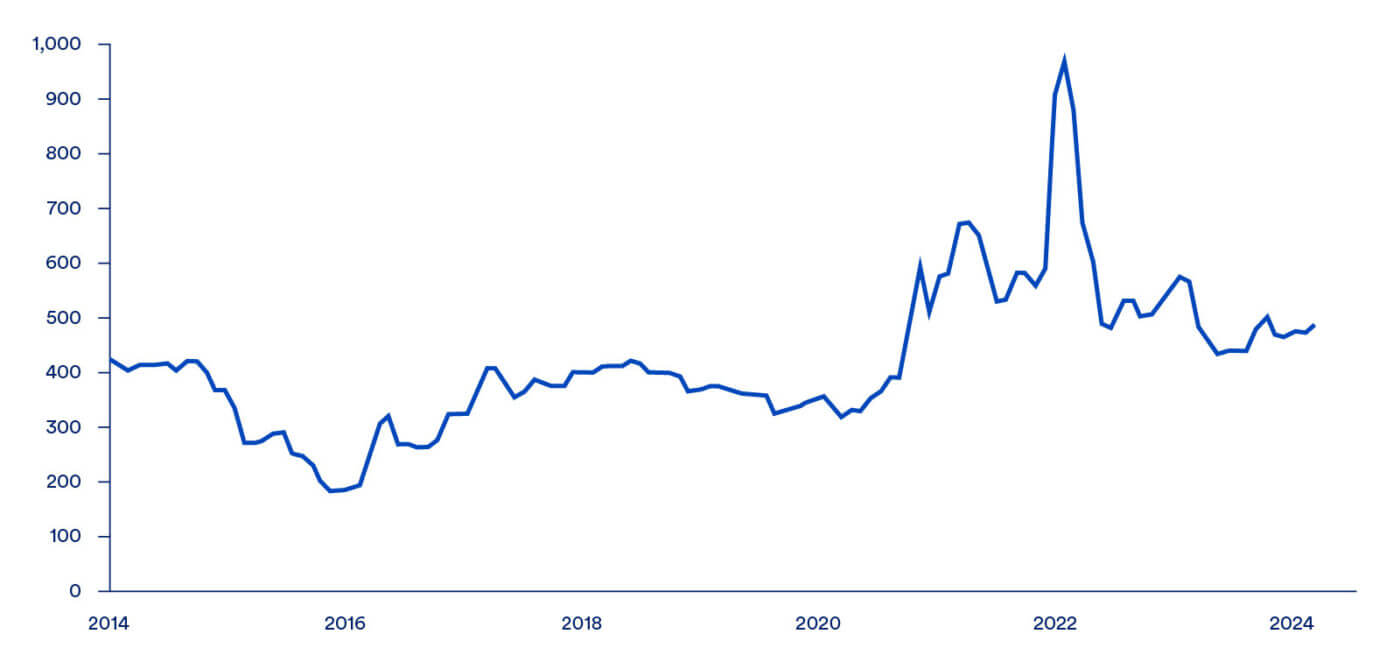
The effect of higher-cost decarbonized steel on downstream consumers’ needs to be considered. Domestic steel prices are already amongst the highest in the world, which can be a challenge for manufacturers who purchase steel and compete with imported products that were produced with lower-cost steel. The decarbonization process will inevitably increase costs for domestic producers, raising prices even further. The displacement of domestically produced steel products by imported products has long been a concern for the domestic steel industry, where it is known as “indirectly traded steel.” If tariffs and CBAM-like mechanisms are not applied to finished products produced with steel, it risks offshoring production of these products, potentially retarding global decarbonization as well as damaging domestic labor markets.
A second go-to-market strategy is being implemented by Cleveland-Cliffs, which has unilaterally imposed a surcharge (CLIFFS H™) on steel produced with lower-carbon DRI, reportedly $40/short ton. In addition, Cliffs has announced plans for an additional surcharge (CLIFFS H2™) for steel manufactured with hydrogen. How successful Cliffs has been in collecting on these surcharges is unknown, but this does represent a different potential pathway for steelmakers to collect additional revenue to offset the higher cost of decarbonized steel.
Decarbonization pathways that significantly reduce the amount of labor runs the risk of alienating employees and taxpayers
Labor effects are an important, and often overlooked concern with decarbonization. While adding CCS equipment to blast furnaces and DRI plants increases employment levels, DRI plants require fewer staff than blast furnaces, and EAF facilities require even fewer. As an example, when U.S. Steel idled the blast furnaces, BOF steelmaking and casters at Great Lakes Works in 2019, 1,545 jobs were eliminated. The capacity was replaced by Big River Steel, an EAF producer which U.S. Steel purchased in 2019-2020. With the same steelmaking capacity of ~3.0 Mt, Big River employs a total of 683 in its entire operations, including steelmaking, casting, rolling, and finishing.47
Another example is Tata Steel’s Port Talbot facility in Wales, UK. Tata will spend U.S. $1.55 billion (including a UK government grant of up to $620 million) to shutter the blast furnaces at this site and replace them with EAFs. This upgrade will reduce carbon emissions but eliminate 3,000 of the 8,000 jobs at this location. In response, one of Tata’s unions announced that they would strike over the job losses, the first work stoppage at this plant in over forty years.48 While converting steel production to the EAF route is often a relatively low-cost decarbonization solution, it can come at the expense of a significant number of jobs. In addition, this move will require Port Talbot to import OBMs, adding additional risk to the supply chain. Maintaining OBM production on-site, either by installing a DRI plant or equipping the existing blast furnaces with CCS would maintain employment and derisk the raw material supply chain.
In contrast, when Cleveland Cliffs announced its planned replacement (with the help of government subsidies) of a blast furnace at its Middletown facility with a DRI/SAF facility, it was careful to note that the new production process would require an increase in staffing at that facility. While this announcement omitted the loss of jobs at the (off-site) coke supplier, actions such as this are useful in winning support from labor. In addition, implementing this pathway will allow Middletown to continue to produce its own OBM, enabling the production of high-quality automotive sheet products supplied from an already existing steelmaking supply chain. In contrast, Tata Steel Port Talbot will need to import large amounts of OBM if it wishes to produce similar products.
Policy options to support steelmaking decarbonization
There are several options that could be used to support the decarbonization of the domestic steel industry, while simultaneously avoiding decarbonization via the offshoring of manufacturing. These have been split into supply side and demand side options listed below.
Supply side options:
Supply-side policies focus on reducing the carbon intensity of steel manufacturing inputs and processes through incentives or mechanisms such as regulations targeting steel producers. As access to clean electricity is the quickest and easiest way to reduce emissions, effort should be made to increase the amount of available clean energy through subsidies and/or regulations. It is also worthwhile to provide support to companies willing to invest in their own clean electricity supply. As one example of this, the new Hybar mill, presently under construction in Arkansas, was partially financed with $330 million of certified Climate Bonds due to the solar infrastructure being installed at the plant.49 Further support for enhancing hydrogen infrastructure should be considered, with the goal of enhancing availability and reducing costs. This could take the form of additional grants, subsidies or increasing already existing programs such as the 45V credit.
Decarbonization targets will determine the viability of CCS for integrated mills and DRI facilities. As CCS is relatively low cost, it is a viable solution given a decarbonization target that is within its capabilities. Due to diminishing returns for higher capture rates on total direct facility emissions, however, CCS alone may be insufficient for facilities targeting near-complete decarbonization.
Stricter environmental regulations could pressure steel mills with older integrated facilities (and coke batteries in particular) to move to cleaner technologies, but also pose risks. The EPA recently tightened hazardous air pollutant emission standards for steel mills,50 and further restrictions could be implemented. Such emission control requirements impose compliance costs, which may result in facility closures and/or offshoring of steel production if not combined with other supportive policies. Further declines in blast furnace production will likely be replaced by either DRI produced with natural gas or imported material.
A carbon tariff on imported goods (like the European CBAM) could be considered. This would tax the carbon contained in imported steel and OBMs, supporting domestic production and employment. It would be particularly useful to extend this tariff to all steel-containing goods, to prevent the offshoring of domestic manufacturing to regions with lower cost, higher carbon-intensity steel.
Policies to reduce upstream fossil fuel methane emissions should be continued, and receive further emphasis, as upstream methane emissions can be a significant portion of total emissions for processes utilizing natural gas or other fossil fuels (including for electricity generation), and those emissions can be significantly reduced using emissions standards for relevant facilities.
Demand side options:
Demand-side policies focus on creating market incentives for low-carbon steel by influencing purchasing decisions. For example, Inflation Reduction Act provisions for procurement of low-carbon construction materials could be expanded.51 Tax credits could be provided to consumers who purchase products with a low carbon burden. The structure of this could be similar to the way that subsidies for EVs and the Energy-Efficient Home Improvement Credit have been implemented.
Construction has been one of the most challenging markets for decarbonization. Building codes could be modified to add decarbonization requirements, or green building codes (IgCC52) could be directly adopted to drive demand for decarbonized steel.
Conclusion
Public policy will be a significant driver if the U.S. is to successfully decarbonize its steel industry. As a commodity, price is one of the driving factors in steel purchases, and the process of decarbonizing steel production almost always results in a higher-cost product. The various issues regarding supply chain security and employment levels are inherently intertwined with this process. It will require careful navigation of costs, employment, trade, and supply chain / national security concerns to arrive at a successful solution that addresses all these issues.
Appendix 1: U.S. Integrated Mill Profiles
Gary
Gary is a 7.5 Mt/y capacity integrated steelworks located on Lake Michigan in Gary, Indiana. The 116-year-old mill is owned by U.S. Steel and has been operating since 1908. Gary Works is U.S. Steel’s largest plant and operates four blast furnaces, six BOFs, a vacuum degasser, and four slab casters. Blast furnace relines occurred between 2011 and 2017. CRU expects the furnaces to remain online through 2035. The finishing facilities produce hot-rolled, cold-rolled, coated sheets, and tin mill products to service the automotive, construction, containers, energy, and service markets. In 2015, the plant permanently closed its coke making operations and now sources coke both internally and externally. In August 2018, U.S. Steel announced a $750 million investment in facility upgrades and new machinery. In 2024 the plant made an agreement with CarbonFree to implement carbon capture systems with a target of up to 50 kt of CO2 captured annually. The technology implemented has not been done at any larger scale and captures less than 1% of Gary’s emissions. Gary employs ~3,800 people.
Burns Harbor
Burns Harbor is a 4.5 Mt/y capacity integrated steelmaking facility located on Lake Michigan in northwest Indiana. The 60-year-old facility sits on a 2,000-acre site is owned and operated by Cleveland-Cliffs. Through the acquisition of ArcelorMittal, Cleveland Cliffs began operating Burns Harbor in 2020. Burns Harbor operates two blast furnaces, three BOFs, and two pickle lines. The blast furnaces were last relined 17-18 years ago and at least one reline was announced for 2026. Products from the site are hot and cold rolled coil, carbon and alloy heat treated plate sheet, and coated sheet. The main consumers of products from the Burns Harbor plant are automotive, construction, and manufacturing industries. Burns Harbor employs ~4,000 people.
Indiana Harbor
Indiana Harbor is a 5.0 Mt/y capacity integrated steel works located in Indiana. The plant is owned by Cleveland-Cliffs, who acquired it during the acquisition of ArcelorMittal USA in 2020. The facility underwent changes as a part of the previous owners ‘footprint optimization’ project. Originally the location was broken down into Indiana Harbor East and West. The east facility was established first in 1901 and known as Inland Steel, while the west addition was made in 1923 originally named LTV steel. In 2023, production was shut down at the west facility and the final BOF was put on an indefinite idle leaving the 120-year-old east portion of the operation. Indiana Harbor has one active blast furnace, four basic oxygen furnaces, and finishing lines to serve the appliance, automotive, construction, service centre, and tubular markets. Three years ago, the blast furnace was relined. The facility services Indiana Harbor employs ~3,700 people.
Cleveland
Cleveland is a 3.3 Mt/y capacity integrated steelworks located in Cleveland, Ohio. The 900-acre site is owned by Cleveland-Cliffs and sits on the Cuyahoga River, providing access to the Port of Cleveland and the Great Lakes for shipping. Cleveland has been operating for more than 100 years. Cleveland operates two blast furnaces that feed two steelmaking facilities. Both furnaces are estimated to require a reline circa 2030. The site produces hot and cold rolled coils as well as hot-dip galvanized sheet for the automotive, construction, and service centre markets. The complex is an amalgamation of the former LTV plant operated by Corrigan McKinney Steel from 1913 on the east side of the river, and the former Republic Steel plant established in 1914 on the west side by Otis Steel. The entire facility was closed 20 years ago before being bought by International Steel Group who restarted production before being sold to Mittal Steel. Four years ago, Cleveland-Cliffs acquired the facility in the purchase of ArcelorMittal USA. Cleveland employs over 4,000 people.
Middletown
Middletown is a 3.2 Mt/y capacity integrated steel plant located in southwest Ohio – it is one of only two operating integrated facilities not directly on the Great Lakes. Despite its regional difference the plant has established rail links, necessary for transporting iron ore to the plant. The 2,800-acre site is owned and operated by Cleveland Cliffs, who acquired it in a purchase of AK Steel in 2020. Operations began in 1901 making the plant 123 years old. The site features a single blast furnace, hot strip mill, and pickling lines which produce hot and cold rolled coil, electro galvanized, and advanced high strength steels. Middletown’s products primarily serve the automotive, construction and infrastructure industries. Cleveland Cliffs recently received federal funding to construct a hydrogen/natural gas fuelled DRI facility and two submerged arc furnaces (SAF) with the same capacity as the current operation. Shifting the pathway to DRI – SAF – BOF is a major step towards reducing emissions. Middletown employs ~3,000 people.
Granite City
Granite City is a 2.8 Mt/y capacity integrated steel production facility located in southern Illinois. The site is owned by U.S. Steel and has been operational for 103 years. The plant houses two blast furnaces and finishing capability to produce HRC and coated sheets for the construction, automotive, container, piping, and tubing industries. The lack of vacuum degassing equipment limits the ability of this plant to compete in the most demanding markets. The facility has faced several stops and starts over the last 10 years. U.S. Steel began closing the steelmaking portion of the facility four years ago, when ‘A’ furnace was indefinitely idled, and ‘B’ furnace idled in 2023. Although idled, the furnaces remain in good condition and could be restarted. Presently, the hot strip mill and finishing facilities are operational, and slab is sourced from Mon Valley and Gary. Granite City employs ~750 people.
Mon Valley
Mon Valley is a 2.9 Mt/y capacity integrated steelmaking operation with four facilities, most are which are near Pittsburgh, Pennsylvania. This is the other operating integrated facility not directly on the Great Lakes. The complex is owned by U.S. Steel and has been operating since 1875. The operation consists of the Clairton, Edgar Thomson, Irvin, and Fairless plants. The Clairton plant is largest coke manufacturing facility in the U.S., supplying both Edgar Thompson and Gary plants. The Edgar Thomson plant has a steel production capacity of 2.9 Mt/y, and features two blast furnaces, two steelmaking vessels, and slab caster. The raw steel slabs are railed to the nearby Irvin plant to be rolled for use in the construction, appliance, service centre, and automotive industries. The Irvin plant produces sheet products includinghot-rolled, cold-rolled, and coated sheet. The Fairless plant (north of Philadelphia on the opposite side of Pennsylvania) produces galvanised sheet from cold-rolled products. Seven years ago, one of the blast furnaces was rebuilt at Edgar Thomson as part of a $388 million investment by U.S. Steel into its flat-rolled steel business. Historically, the Mon Valley plant has been identified by climate activists and government entities as a heavy polluter with multiple pending emissions violations.53 To help curb emissions, U.S. Steel permanently idled the three oldest coke batteries in 2021 and idled a fourth battery in May 2024. U.S. Steel has announced that Mon Valley will run a test with a membrane-based CCS system in early 2025.54 The complex employs ~2,200 people.
Appendix 2: U.S. EAF Profiles
Berkeley
Berkeley is in South Carolina with an annual capacity of 2.9 Mt/y. The facility is owned by Nucor and has been operating for roughly 30 years. The 3,000-acre site is positioned next to the Atlantic Ocean, with incoming and outgoing shipments transported via barge, rail, and road. Berkeley operates two electric arc furnaces and several finishing mills to manufacture flat and long steel products for automotive, infrastructure, and manufacturing industries. Berkeley produces higher quality steel and uses higher OBM inputs (49%), as shown in Figure 26. In the last 30 years there have been expansions to the site, doubling cold rolling production capacity to 1.5 Mt/y, and increasing hot-band capacity to 2.3 Mt/y. Berkeley employs ~700 people.
Columbus (Steel Dynamics)
Columbus is in eastern Mississippi with an annual capacity of 3.1 Mt/y. The 1,400-acre site is owned by Steel Dynamics, who acquired the plant in September 2014 from Severstal. The facility commenced operations in 2007 and was expanded 4 years later to double capacity. Products include hot-rolled, cold-rolled, and coated steels using two EAFs. The site is in the ‘Golden Triangle’ manufacturing zone, providing transport links via rail, road, and barge for inputs and outputs. The facility serves the automotive, agriculture, construction, pipe and tube, machinery, appliance and energy industries in the southern U.S. and Mexico. Like Berkeley, Columbus produces high quality products and uses 25% OBM inputs. Eight years ago, a $100 million paint line was added, providing an extra 0.25 Mt/y coating capacity and diversifying high-margin products manufactured at the plant. Columbus employs ~900 people.
Butler (Steel Dynamics)
Butler is in northwest Indiana with an annual capacity of 3.1 Mt/y. The ~1,100-acre site is owned by Steel Dynamics and has been operational for 30 years. The mill manufactures flat rolled sheet using two EAFs to serve customers in the automotive, construction, appliance, consumer electronics, agricultural, and pipe and tubing industries. Raw material is supplied by Iron Dynamics, Steel Dynamics’ liquid pig iron facility. Iron Dynamics consists of a natural gas fired rotary hearth furnace (RHF) feeding a submerged arc furnace (SAF) that provides high-quality molten iron to the EAFs. The Butler plant uses this liquid iron as a high-quality feedstock to improve economic efficiency by reducing the need to use outside high quality scrap, pig, and DRI. Seven years ago, the galvanizing lines were upgraded, increasing coating capacity by 0.18 Mt/y at the plant. Butler employs ~900 people.
Jewett (Nucor)
Jewett is in Texas and has a capacity of 1.2 Mt/y. The plant is part of Nucor’s longs portfolio and produces long products in the form of sections and rebar. Nucor is responsible for a quarter of all raw steel production in the United States. Like other EAF steel producers, Nucor has multiple scrap processing facilities that supply their steelmaking operations when possible. All production is in a single EAF furnace, which feeds specific product lines. Jewett has been operating for 49 years.
Jacksonville (CMC)
Jacksonville is in Florida with a capacity of 0.75 Mt/y. The plant is 48 years old and owned by Commercial Metals Company (CMC), which purchased the mill from Gerdau in 2018. CMC owns ten mills across the U.S. and produces over 5 Mt of finished long steel products per year. Jacksonville has access to a rail network and is near the port of Jacksonville. Along with the single EAF furnace, CMC has an off-site captive scrap recycling plant. The captive scrap recycling plant processes ferrous scrap metal and sends scrap to the Jacksonville location to be used in the furnace. Jacksonville can produce rebar and merchant bar, but in recent years has only produced rebar. The plant employs ~300 people.
Appendix 3: Cost Methodology
Capital expenses
- CRU estimated CapEx for each of the pathways by reviewing recent similar or identical projects and modifying with assumptions discussed below. The cost assumptions supported by CRU analysts were used in modelling the listed pathways to determine total capital cost.
- Carbon capture capital expenses were estimated using the amount of CO2 captured and whether it is an integrated pathway or DRI-EAF.
- Pathways that have a BOF assume costs are to retrofit existing facilities. This assumes there will be no new integrated facilities constructed in the U.S. The CapEx costs for integrated pathways are for additional technologies, such as DRI, SAF, or CCS.
- For the EAF facilities, CapEx represents the cost of a new facility.
Operating expenses
- Operating costs were modelled using CRU inputs and costs associated with each pathway.
- CRU’s data on existing BF-BOF and EAF facilities forms the basis and increases the accuracy of OpEx estimates.
- Additional research was completed to determine a cost of carbon capture for the BF-BOF and DRI-EAF pathways.
- For pathways using CCS, the additional CapEx is calculated by taking the amount of CO2 captured and multiplied by the respective cost of capture. Different capture costs were applied for the DRI-EAF and BF-BOF pathway.
CO2 abatement levels
- CO2 abatement is calculated relative to the baseline emissions, set by the BF-BOF process. The emissions levels are derived from emissions data collected on U.S. steelmaking facilities.
- Each pathway has an associated emissions level which is used to calculate the actual CO2 abatement versus the baseline, as shown in Table 5.
- CCS efficiency is assumed to be 85% based on existing single point capture data including for blue hydrogen production. The resulting carbon capture rate of 55% for DRI and 63% for BF-BOF represents the percentage of carbon abated from furnace gases, compared to the full steelmaking process. The capture rate and efficiency are based on an assumed single capture system installation, restricting full capture potential, but representing realistic investment behavior.
- Industry research and analysis by CRU Sustainability supports modelling these pathways at a detailed level.
CO2 abatement costs
- Abatement cost is a summary of CapEx and OpEx and does not represent an additional spending requirement. Expenditures are combined to determine the net present value of future expenditures over the next 40 years.
- The abatement cost is calculated by taking the economic costs divided by the actual level of CO2 abatement. This results in a $/ton of CO2 abatement figure.
- Comparing each pathway by abatement cost is effective for determining the most cost-effective solution but is not indicative of overall emissions abated.
Table 6: New equipment/process CapEx requirements
| Option | CapEx per tonne annual capacity | Total CapEx ($)55,56 | Cost basis |
|---|---|---|---|
| CCS Integrated | 500 $/t CO2 | 1.1B | Estimated from 1) database of completed CCS projects 2) literature review, and 3) modelled relationships. Provided on a $/t CO2 captured basis. |
| CCS DRI-EAF | 130-350 $/t CO2 | 325M | Estimated from 1) database of completed CCS projects 2) literature review, and 3) modelled relationships. Provided on a $/t CO2 captured basis. |
| DRI | 550 $/t | 1.4B | Estimated from Cleveland Cliffs and Arcelor Mittal/Voestalpine projects to construct DRI facilities. |
| EAF57 | 450 $/t | 1.1B | Estimated from recently completed EAF projects including Arcelor Mittal, SDI, and U.S. Steel. |
| SAF | 375 $/t | 950M | Estimated using Cleveland Cliffs announced investment in its Middleton facility for two EMFs. |
| BF to DR pellet upgrade58 | 35 $/t | 90M | Estimated using announcements from Cleveland Cliffs and U.S. Steel for projects to upgrade iron ore feedstock. |
Carbon capture costs
Several factors influence the cost of implementing CCS on an industrial process, but CO2 content in the captured gas stream and the pressure of the system drives major differences in capital and operating cost. These factors determine the size of equipment needed and the efficiency at which that gas is processed and, therefore, the most economically capturable amount of CO2. Transport and storage add to the operating expenses for a plant utilizing CCS, which is variable based on the available transport options and the capacity and geological characteristics of the storage site. The underlying drivers for CCS cost are the same for integrated mills, DRI, and EAFs. Their CCS cost profiles reflect differences in processing technique, gas chemistry, and site layout.
- CRU’s understanding of carbon capture costs was developed by analysing the capital cost of CCS projects across major industries such as oil and gas, power generation, cement, and hydrogen production. This established a relationship between gas chemistry and pressure, and the capital and operational expenditures, establishing the analytical baseline. Through combining capture system costs, labor cost, and the constraints associated with steel facilities, the CCS cost basis was established. From this baseline, adjustments were made to accurately reflect the gas concentrations and pressures found in the pathways considered in this report.
Figure 46: Average CapEx for CCS projects in major applications, $/annual t CO2
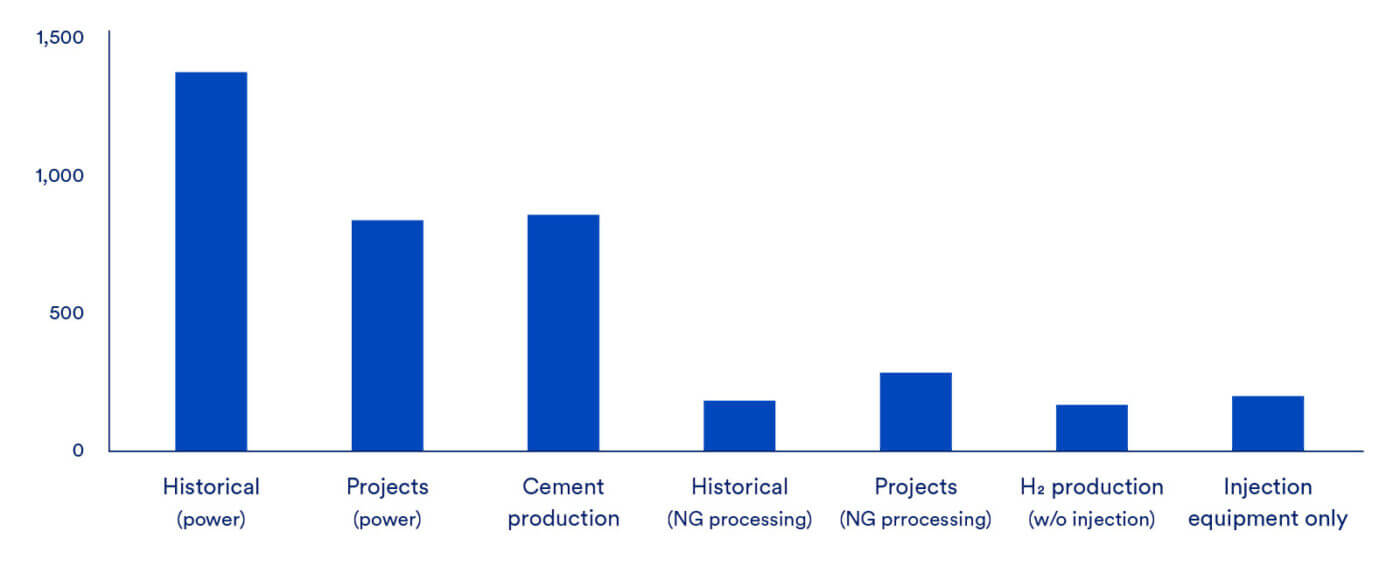
Figure 47: Total capital expenditure, $/t CO2 /y versus captured gas carbon content, %
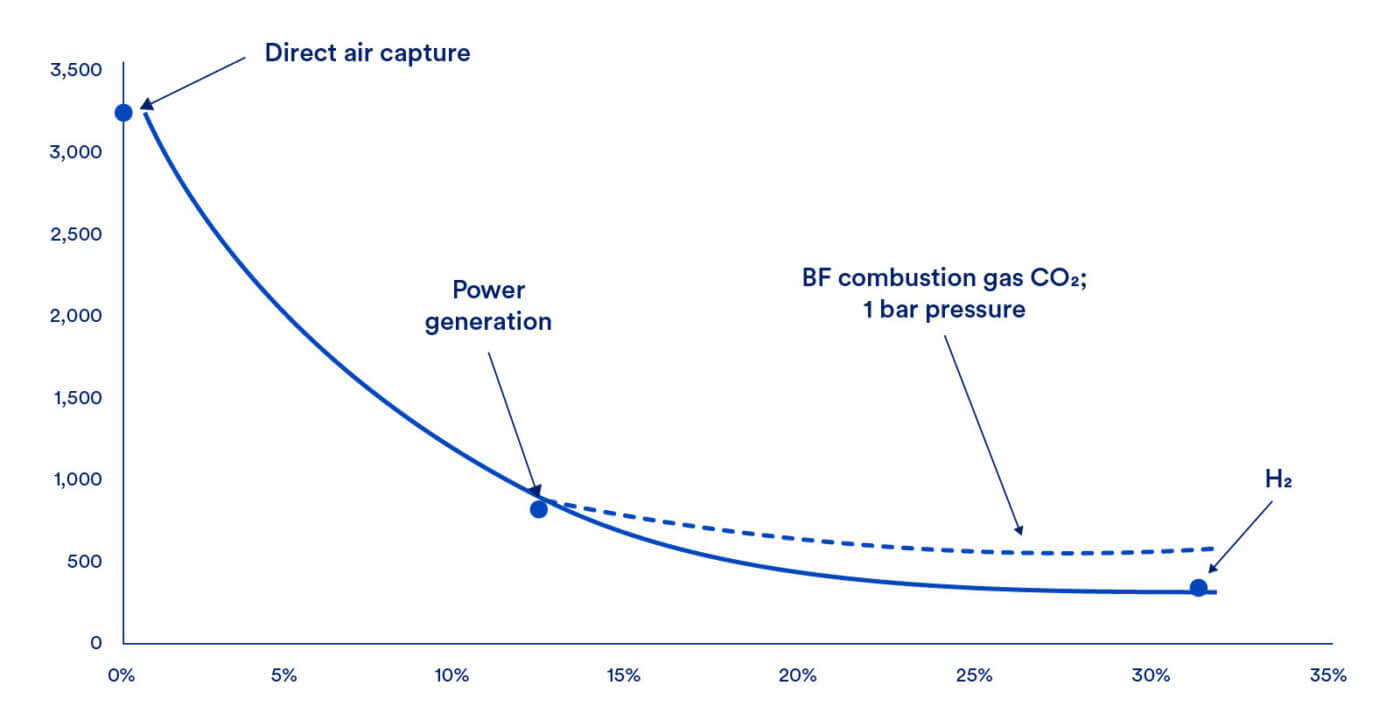
The gas streams in the steelmaking routes in this study typically match those in power plant and cement production from a pressure perspective, but mostly have higher carbon contents. For power and cement, the average pressure is low (around 1 bar), and the CO2 content varies from 12%-15% whereas the gas stream from a power station in an integrated mill is between 20%-27% CO2, depending on the mix of fuel gases used. Thus, the overall cost of CCS at a steel mill site is expected be more expensive than oil and gas systems, which process high content, high pressure streams, but less expensive than equivalent facilities on power and cement plants. Application of CCS directly on the blast furnace gas stream could potentially lead to lower costs of captured CO2, given the higher concentration of CO2 (i.e. 25%) and elevated pressure, however, the amount of overall CO2 capturable will be low, as discussed above.
Based on the modelling behind Figure 47, the CapEx for a single CCS system on an integrated mill is roughly $500/t of CO2 abated. This capital cost is based on the capture of gas from one location: this could be at the power plant or on the blast furnace hot stoves (i.e. post combustion), or it could be directly on the blast furnace gas as it comes out of the furnace (i.e. pre-combustion). The latter option may have marginally lower CapEx cost, given the slightly higher pressure of the blast furnace gas system, however, as for the BF stoves, the overall capture capability will be low at <35% of overall emissions (n.b. CCS on hot stoves may give a maximum capture capability of ~20%). The construction of any new blast furnaces in the U.S. is considered unlikely, so it is assumed that carbon capture will be retrofitted to existing equipment, that costs will be uniform, and there will be little in the way of efficiency gains from optimally configuring the facility.
The situation for DRI is different in many respects. The cost of implementing CCS on a DRI plant depends on the reduction technology present at that plant, as well as the target capture rate for that given facility. For Midrex plants in the USA that use Midrex technology, CCS CapEx is expected to be around $350 per tCO2 captured, given the high CO2 concentration of the process gas treated, but this will not cover full capture of emissions (see below). However, DRI plants built using Tenova’s “ENERGIRON” technology (such as Nucor Louisiana) can take advantage of integrated capture technology originally aimed at improving gas stream recycling. These latter systems only require a compressor and some associated equipment to condition the captured furnace emissions. In this case, the CapEx can be as low as $130 per tCO2 captured, however, again, this only covers emissions from the process gas stream. To achieve full abatement, gas streams from the remaining processing points would need to be rerouted, or additional Capture equipment must be installed.
OpEx costs for CCS revolve around electricity, steam, amines (if applicable), labor, transport, and storage. Given the above considerations, it is considered best practice for an integrated mill to route as much off-gas as possible, and certainly blast furnace gas, to its power station to generate electricity but, importantly, to provide a single point of capture for the most CO2 intensive gases. Figure 30 shows the emissions source breakdown and the capture rate associated with power station capture and rerouted furnace gasses. A mill will need to generate or purchase additional electricity to support the increased load. The typical power use for CCS is around 125–150 kWh/tCO2, mainly for the CO2 compressor but also for other pumps and ancillary services, and steam usage is ~2.5 GJ/tCO2, mainly for stripping CO2 from the absorber medium. Assuming power costs of $60/MWh and natural gas at $5/GJ, the energy costs of a CCS system will be $20–$25/tCO2. With the addition of operating and maintenance costs, including labor, at $20/tCO2 and CO2 transport and injection of $15/tCO2 – typical for the U.S. but dependent on the proximity of a storage site and available pipelines – the expected processing costs would fall around $55-$60/tCO2.
Additional points of consideration include the following:
- There are significant cost differences between direct reduction plants, where the reduction technology being used may already utilize capture equipment. For example, Energiron DRI plants are the exception to the standard rate of CCS costs and efficiency. Because the system contains a preexisting capture point on the process gas, only a compressor and related equipment is needed to achieve the standard 55%-60% capture rate.
- The decision to capture combustion gas, process gas, or both leads to significant divergence in the cost of CCS for DRI plants. To achieve the baseline capture rate of 55%-60% of total emissions for a natural gas plant through exclusively process gas capture, the CapEx for a 1Mt/y would be around $110/tCO2 captured. To reach 90% CO2 captured, CCS would need to be fitted to the combustion stream as well, increasing costs.
- Transportation and storage costs include the standard charges associated with operating costs, as well as capital charge costs. CRU estimates the cost of transport and storage to be around $20 per tonne of CO2 for processing, and $50 per tonne CO2 in capital charges with some variance based on the cost of labor and storage site maintenance. The CapEx for companies considering installing privately owned lines would be $1-$3 million per mile (km). Costs will vary based on distance, transported volume, geographic and community constraints, and raw material costs. It is still unclear if steel producers will bear the burden of additional transportation and storage costs, or the infrastructure will be built out and supported by a third party.
- The Northern Lights project in Norway (expected to begin operating in early 2025) provides an example of greenfield costs for transportation and storage. The CapEx for transportation and storage alone is estimated at $1.025 billion for service to both capture plants.59 The transport and injection costs for Northern Lights are estimated to be higher than U.S. figures at around 40-80 euro/tonne of CO2.
- Given the complexities of constructing a CO2 transmission pipeline, the steel industry will likely rely on existing pipelines, rights-of-way, and trucklines built and operated by outside firms for infrastructure related to CCS transport and storage.
- According to the EPA, the Great Lakes region is home to two of thirteen operating geological sequestration locations in the U.S.60 This region hosts the Illinois Basin, which offers significant and proven carbon storage capacity. Third party storage developers or dedicated off takers may invest in expanding the region’s capabilities, offering flexibility to steelmakers looking to store CO2. If they were to use the sequestration site located in midland Illinois, the average distance a Great Lakes mill would have to transport their gas is 100-200 miles.61 This figure is subject to change upon the theoretical completion of new storage infrastructure.
- Enhanced oil recovery represents the majority share of CO2 processing among the pipelines analysed. Thus, the capital cost of building pipelines to service the steel industry may be higher than current estimates.
- Southern steelmaking operations have longer transport distances as more northern states like North Carolina must choose between Illinois and Louisiana storage sites. There is future potential for offshore storage, but the practice is relatively costly. In addition, much of the East Coast is subject to a 10-year offshore drilling ban, which presumably would prevent the development of offshore CCS storage.
Appendix 4: Glossary for the report
| Term | Definition |
|---|---|
| BF | Blast furnace |
| BOF | Basic oxygen furnace |
| CAGR | Compound annual growth rate |
| CapEx | Capital expense or expenditure |
| CBAM | Carbon border adjustment mechanism |
| CCS | Carbon capture and storage |
| Clean electricity | Electrical power generated from renewable and nuclear sources |
| CRC | Cold rolled coil |
| DR | Direct reduction |
| DRI | Direct reduced iron |
| EAF | Electric arc furnace |
| EMF | Electric Melting Furnace |
| EOR | Enhanced oil recovery |
| ESG | Environmental, social, and governance |
| GHG | Greenhouse gas |
| HBI | Hot-briquetted iron |
| HDG | Hot-dipped galvanized steel |
| HMS | Heavy Melting Scrap, a type of low-quality scrap There are 2 types, #1 and #2, with #1 being higher quality |
| HRC | Hot rolled coil |
| kT | Thousand tonnes |
| KWh | Kilowatt hours (one-thousand-watt hours) |
| LCOE | Levelized cost of electricity |
| Metallics & Ferroalloys | Primarily scrap and DRI |
| Mt | Million tonnes |
| MW | Megawatt |
| OCS | Organic coated sheet |
| OBM | Ore-based metallics (DRI/HB and pig iron) |
| OEM | Original equipment manufacturer |
| OpEx | Operating expense or expenditure |
| PCI | Pulverized coal injection |
| SAF | Submerged arc furnace |
| Section 232 | Section 232 tariffs, implemented in 2018 under the Trump administration, introduced a 25% Ad-Valorem tariff on all steel products (but not raw materials) imported into the U.S. The tariffs apply regardless of free trade agreements. |
| SBQ | Special bar quality |
| Pig iron | Product of smelting iron ore with a high-carbon fuel and reductant such as coke |
| Reductants | Can be any reducing agent used ex: coking coal |
| Reformer | In the context of steel production, a reformer unit creates a reduction gas (generally a blend of H2 and CO) that is used to reduce iron oxides to metallic iron. |
| SBQ | Special Bar Quality, a type of high-quality bar used for forging and load-critical purposes such as axles and gears. |
| Scope 1 emissions | Scope 1 GHG emissions are those from sources that lie within the entity boundary of the mine or plant. The entity describes a standard set of processes that each mine or plant could have, allowing for differences in technology routes. Scope 1 emissions include those from electricity generation if the mine or plant contains the power plant within its entity boundary, meaning most of the power from the plant is used in that activity. |
| Scope 2 emissions | Scope 2 GHG emissions are those from electricity and other types of energy purchased by the mine or plant and brought into the entity boundary of the mine or plant. Scope 2 emissions can also include purchased heat streams, such as purchased steam. |
| Scope 3 emissions | Third party input purchases are designated as Scope 3 emissions and refers to CO2e emissions which add to the emissions estimate. As our core purpose is to provide an emissions benchmark, CRU only considers additions for imports of intermediate products and agglomerates to be used in the steel-making system boundary to make crude steel. Currently CRU includes metallurgical coke, Blue H2, Grey H2, Green H2, and Syngas, sinter, BF and DR pellet, pig iron, DRI, burnt lime, burnt dolomite, oxygen, neon, and argon. Methane and CO2 emissions from the natural gas supply chain are not included in CRU’s scope 3 figures. Excluding the natural gas supply chain, CRU only considers purchases where these emissions are material and where errors in accuracy of measurement and inclusion are smaller than the error of exclusion. CRU’s methodology conforms to international standards used to monitor the crude steel-making industry. |
| t | Metric tonnes |
| tcs | Tonnes of crude steel |
| TWh | Terawatt hour |
Footnotes
- The four largest U.S. steelmakers are, in order of size, Nucor, Cleveland Cliffs, U.S. Steel and Steel Dynamics
- https://worldsteel.org/publications/policy-papers/climate-change-policy-paper/
- https://www.steel.org/wp-content/uploads/2023/06/American-Steel-Carbon-Advantage-_-Final-2023_updated-June-6-2023.pdf
- There is no legally accepted definition of ‘green’ or ‘low carbon’ steel. ‘Low carbon’ products are associated with emissions below 0.4t CO2e/t of finished steel.
- Site costs in the context of this report are all costs involved in the operation and maintenance of a given site within the confines of operating area.
- Net imports = imports – exports
- Some mills import steel in semifinished slab and billet form and then roll it to the final product.
- The section 232 tariffs, implemented in 2018 under the Trump administration, introduced a 25% Ad-Valorem tariff on all steel products imported into the U.S. The tariffs apply regardless of free trade agreements.
- Note: Most European trade volumes originate from EU member states and surrounding countries. Southeast Asian BF-BOF production will grow at a CAGR of 7.5%. New BF-BOFs are under construction across the Southeast Asia region, which will be supplied mostly with imported iron ore and coking coal coming from well stablished trade routes. Between 2023–2028, CRU expects Southeast Asian BF-BOF production to increase at a compound annual growth rate (CAGR) of 7.5%. The CAGR of EAF based steelmaking will be around 1% in the same period.
- Build America, Buy America Act, Pub. L. No. 117-58, Title IX, §§ 70901-70953, 135 Stat. 1295 (2021). The Act requires that federally funded infrastructure projects use domestically-produced iron, steel, manufactured products, and construction materials, subject to limited exceptions.
- Note: BF = Blast furnace, DRI = Direct reduced iron, BOF = Basic oxygen furnace, EAF = Electric arc furnace, SAF = Submerged arc furnace (electric melting furnace). Further abbreviations explained in the glossary.
- Primetals Technologies’ COREX® process uses coal as a source of syngas to reduce iron. Available since the late 1980s, the process is used primarily in Asia and Africa – there are no COREX plants in the Americas.
- Unwanted elements such as copper, along with alloying elements from steel scrap’s first production cycle.
- HMS = Heavy melting scrap, a low-quality type of scrap.
- https://www.catf.us/resource/decarbonising-materials-for-the-energy-system-transition/
- Capacity figures shown are indicative of reported capacity which may be different from accessible capacity.
- Source: CRU
- The difference in scope 3 emissions between U.S. steelmaking facilities is the result of supply chain dynamics and material mix variance. The impact is greatest amongst EAFs where the ratio of scrap to OBMs directly impacts scope three intensity, with scrap intensive operations at the front of the curve, and metallics heavy operations presenting elevated emissions levels.
- Refer to appendix 3 for glossary of terms and categories.
- Scope 1, 2, and 3 emissions, excluding upstream emissions for coal (i.e., upstream of coke making) and natural gas.
Source: CRU - EAF energy costs may include coke or PCI for carbon, especially when oxygen is blown in the melt.
- Excludes some emissions from upstream fossil fuel emissions for power generation and for natural gas utilized directly at EAF plant.
Source: CRU - Industrial Carbon Capture from an Existing Hot Briquetted Iron Manufacturing Facility Using the CryocapTM FG Process (DE-FE0032221) https://netl.doe.gov/sites/default/files/netl-file/24CM/24CM_PSCC_6_Giardinella.pdf
- Industrial Demonstrations Program Selections for Award Negotiations: Iron and Steel https://www.energy.gov/oced/industrial-demonstrations-program-selections-award-negotiations-iron-and-steel
- Research is being done on CCS for the EAF itself. For example, see https://nucor.com/news-release/nucor-and-the-university-of-kentucky-receive-federal-grant-for-carbon-capture-r&d-at-gallatin-mill-122742
- Primary steel pathways can make the highest quality steel using high-quality inputs, whereas secondary (remelt) production is constrained by the availability of OBMs.
- Total CapEx is not annualized and represents the overall costs of capital required for the life of the asset.
- Excludes emissions from the coal and natural gas supply chains, which can be significant. See Section Natural gas supply chain considerations. Green hydrogen and clean electricity pathways assume zero carbon intensity of electricity inputs for the entirety of the pathway. All other pathways assume an average grid carbon intensity of 0.32 t CO2e/MWh, which underestimates intensity to some degree since it does not include upstream emissions for fossil-fuel-fired power plants.
- It is likely that Carbon transport and storage will be covered by third-party services, thus pipeline CapEx is not included in pathway totals.
- Prices used for all reductants come from CRU. Green hydrogen: 4.6 $/kg. Blue hydrogen: 2.1 $/kg.
- Relative to BF-BOF baseline. However, end chemistry of steel will be more variable for this pathway and standalone EAF as they are subject to scrap quality.
- Analysis in section Natural gas supply chain considerations performed by CATF based on https://www.catf.us/resource/analysis-lifecycle-greenhouse-gas-emissions-natural-gas-coal/
- Zecca, N., Cobden, P. D., Lücking, L., & Manzolini, G. (2023). SEWGS integration in a direct reduction steelmaking process for CO2 mitigation. International Journal of Greenhouse Gas Control, 130, 103991. https://doi.org/https://doi.org/10.1016/j.ijggc.2023.103991
- IEAGHG Case 3 for natural gas requirements for hydrogen production. IEAGHG, “Techno – Economic Evaluation of SMR Based Standalone (Merchant) Hydrogen Plant with CCS”, 2017-02, February 2017.
- A $500 million investment would incur a $40 $M/y charge, with an OpEx of ~$50/t CO2 per year for a total uplift in cost of $90 million per year. If the DRI plant can secure full credits under 45Q tax credit for sequestration, $85 million of the $90 million will be covered, making the investment an easy win.
- https://netl.doe.gov/projects/files/FECMNETLCO2TransportCostModel2022DescriptionandUsersManual_031422.pdf
- https://www.reuters.com/markets/commodities/giant-pipeline-us-midwest-tests-future-carbon-capture-2021-11-23/
- https://netl.doe.gov/sites/default/files/event-proceedings/2017/carbon-storage-oil-and-natural-gas/posters/Martin-Dubois-CO2-pipeline-cost-analysis-utilizing-a-modified-FENETL-CO2-Transport-Cost-Model-tool.pdf
- End-of-life or obsolete scrap is derived from used steel products recycled at the end of their useful life.
- Prime scrap generated during manufacturing activities and is considered the cleanest and most valuable steel scrap grade.
- https://www.energy.gov/oced/regional-clean-hydrogen-hubs-selections-award-negotiations
- https://www.h2greensteel.com/
- Blue hydrogen differs from gray and brown hydrogen only in the last step, which involves CCS to lower direct CO2 emissions from the steam reforming of natural gas (blue) or the gasification of coal/lignite (brown). In contrast, green hydrogen is produced through water electrolysis using renewable energy with ~zero carbon emissions. Carbon emissions from hydrogen production is a critical concern in the pursuit of sustainable energy solutions.
Table 5 shows that the CO2 intensity of blue hydrogen pathways more than 4 times that of green, meaning that even with CCS, blue hydrogen from natural gas may have overall emissions that are on par with burning natural gas or coal for heat. Upstream emissions for green hydrogen are very low, but only if produced using dedicated renewable energy sources. Blue hydrogen however can have upstream emissions from gas processing, transport, and distribution that are more than double the direct emissions depending on the assumptions made or the actual operating characteristics of the hydrogen and CCS plants. Additional upstream emissions will be associated with the power needed for CCS operations (i.e. CO2 compression. So, although CCS reduces direct carbon dioxide emissions, upstream emissions are not treated, and underscore the need for rigorous emission evaluation.
- https://www.rggi.org/
- https://sustainability.crugroup.com/article/usa-needs-more-incentives-beyond-the-ira-to-meet-its-climate-targets
- https://cruonline.crugroup.com/analysis/article/165788/indian-steel-mills-most-disadvantaged-under-cbam
- Responsible Steel Certified Site, audit with staff numbers listed, retrieved 25-Jun-2024
- Tata steel workers call first strike in 40 years, BBC, 21-Jun-2024
- https://renewablesnow.com/news/hybar-issues-usd-330m-climate-bonds-for-sustainable-steel-rebar-mill-830286/, retrieved 25-Jun-2024
- https://www.federalregister.gov/documents/2024/04/03/2024-05850/national-emission-standards-for-hazardous-air-pollutants-integrated-iron-and-steel-manufacturing
- Inflation Reduction Act, Pub. L. 117-169 §§ 60503, 60506.
- International Green Construction Code
- As one example, U.S. Steel hit with $1.9 million fine over Clairton coke emissions.
- https://investors.ussteel.com/news-events/news-releases/detail/644/netl-collaborates-with-u-s-steel-to-capture-greenhouse
- Reflects CapEx necessary for a 2.5 Mt/y facility.
- Costs presented are greenfield costs except for CCS which assumes preexisting infrastructure present in BOF and DRI plants.
- EAF cost includes full site cost (steelmaking, casters, secondary production), to represent standard procedure for EAF installations.
- Assumes brownfield costs. Greenfield development of a DR pellet facility would more than triple CapEx.
- https://netl.doe.gov/sites/default/files/netl-file/20CCUS_Carpenter.pdf
- https://www.epa.gov/ghgreporting/supply-underground-injection-and-geologic-sequestration-carbon-dioxide
- An additional storage basin is in Northern Michigan, which actively supports several gas injection facilities.
Credits
Report prepared by CRU International Limited for Clean Air Task Force
Contributing Authors: Sam Bailey, Toby Lockwood, Ghassan Wakim

